Supermetrics for Claude
Connect Google Analytics 4 to Claude — Ask Your Analytics Anything


Every GA4 question used to mean another custom Exploration. Now just ask Claude — traffic sources, conversion funnels, content performance, and user behavior, answered in seconds without touching the GA4 interface.
Why Connect Google Analytics 4 to Claude?
No more custom reports or multi-step Explorations. Just ask what you want to know.
- Claude replaces the painful process of building GA4 Explorations for every question. Ask "Where did my traffic spike on Tuesday come from?" or "Which channels grew most last quarter?" and get instant answers with data tables. It handles source/medium parsing, channel grouping, and time comparisons automatically — no more dragging dimensions into a freeform exploration and waiting for it to render.
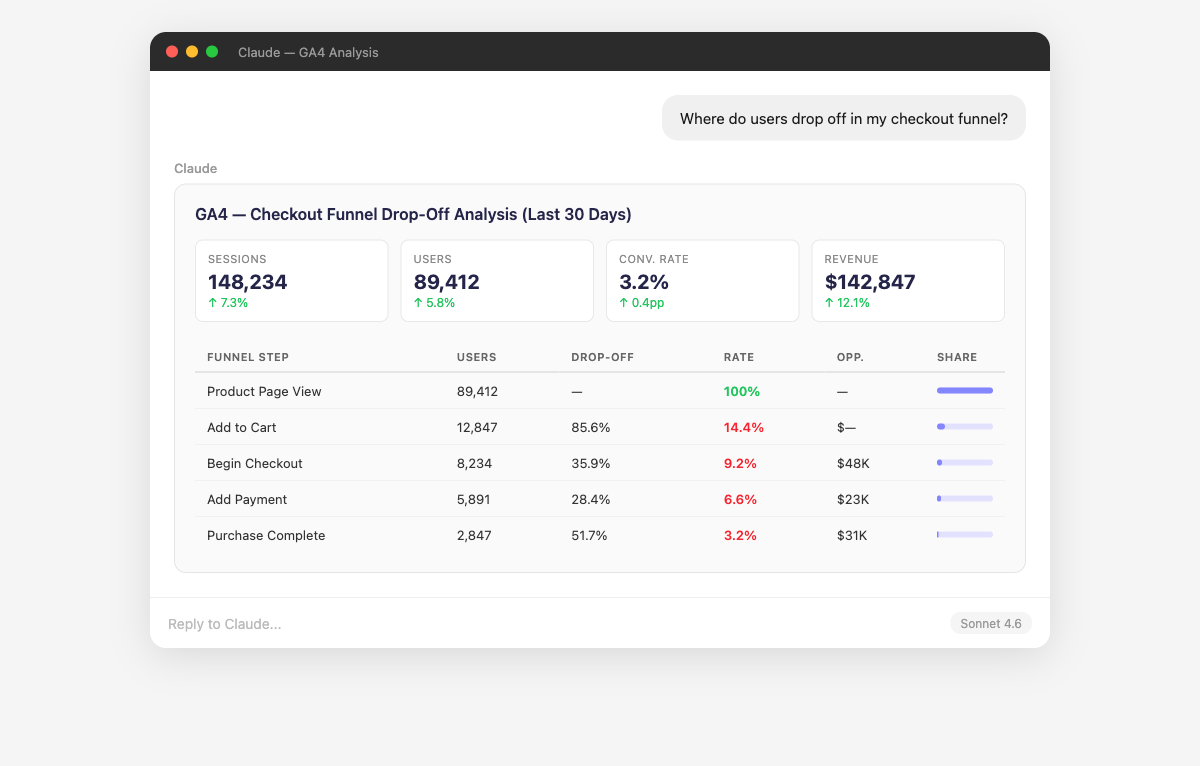
- Claude builds conversion funnels from your GA4 event data, showing drop-off rates between each step — page view to add-to-cart to checkout to purchase. It identifies which landing pages have the highest conversion rates and which ones leak users despite high traffic. Ask "What's the conversion rate from product page view to purchase by traffic source?" to understand which channels bring buyers, not just browsers.
- Claude ranks your pages by engagement time, scroll depth, and conversion contribution to show you which content actually works. It identifies pages with high engagement but low conversion (entertainment value, not business value) and pages with high bounce rates that need immediate attention. Ask "Which blog posts drive the most signups?" or "What pages do users visit before converting?"
- Claude compares your current metrics against historical baselines and flags significant deviations — a 40% traffic drop on a Tuesday, a sudden spike in bounce rate on mobile, or a conversion rate that halved overnight. It correlates anomalies across dimensions to suggest causes: "Your organic traffic dropped 35% — this coincides with a ranking change for your top 5 landing pages." Ask "Anything unusual in my data this week?" for a quick health check.
- Claude combines GA4 conversion data with spending data from Google Ads, Facebook Ads, and other platforms to calculate true acquisition costs. It reconciles GA4 attribution with platform-reported conversions to identify discrepancies. Ask "Which ad campaigns drive the most engaged sessions?" or "What's the real CPA when using GA4 conversions instead of platform-reported conversions?"
- Claude slices your GA4 data by any combination of dimensions to reveal audience patterns you wouldn't spot in standard reports. Compare new vs returning users, mobile vs desktop behavior, or geographic segments on engagement, conversion, and revenue. Ask "How do users from paid search behave differently than organic visitors?" or "Which countries have the highest revenue per session?"
How to Connect Google Analytics 4 to Claude
Three steps. Under two minutes. Zero code.

- 1
Open Supermetrics in Claude
Visit the Supermetrics connector page in the Claude directory and click Connect to link your Supermetrics account.
- 2
Authorize Google Analytics 4
Authorize Google Analytics 4 when prompted — just a quick sign-in, then you're ready to go.
- 3
Start Asking Questions
Ask Claude anything about your GA4 data in plain English. No queries, no exports, no waiting.
Example Claude Prompts for Google Analytics 4
Copy these prompts or use them as inspiration. Claude understands natural language — just ask what you want to know.
How Teams Use Google Analytics 4 in Claude
Click a role to see tailored prompts and analysis examples for your workflow.
- “Which traffic sources grew the most in the last 30 days? Break down by source/medium with session and conversion trends.”
Identify emerging growth channels before your competitors do.
“Show me the conversion rate by landing page for organic traffic. Which pages should we optimize first?”Prioritize SEO landing page optimization by business impact.
“Compare new users vs returning users on conversion rate, revenue, and engagement time. Are we retaining well?”Understand the balance between acquisition and retention in your growth model.
- “What events fire most frequently on my product pages? Which features do users engage with most?”
Understand feature adoption and user behavior patterns from event data.
“Where do users drop off between signup and first value moment? Show the funnel step by step.”Identify onboarding friction points that prevent users from reaching activation.
“Compare engagement metrics before and after our last release. Did the new feature improve key metrics?”Measure the impact of product changes with before/after analysis.
- “Which blog posts drive the most conversions? Rank by conversion rate with minimum 100 sessions.”
Find content that converts, not just content that attracts traffic.
“What's the average engagement time by content category? Which topics keep readers engaged longest?”Understand which content themes resonate most with your audience.
“Show me the path from blog content to conversion. What pages do users visit between reading a blog post and converting?”Map the content-assisted conversion journey to optimize internal linking.
- “Give me a monthly executive summary: total sessions, conversion rate, revenue, and channel mix with month-over-month changes.”
Board-ready website performance summaries generated in seconds.
“Which marketing channels have the best revenue per session? Where should we increase investment?”Data-driven channel investment recommendations for budget planning.
“How is our overall conversion rate trending over the last 6 months? Any seasonal patterns?”Track the strategic health of your digital funnel over time.
What Google Analytics 4 Data Can You Analyze in Claude?
Supermetrics gives Claude access to your full GA4 reporting data — metrics and dimensions you already know from the GA4 interface.
Key Metrics
- Sessions
- Users
- New users
- Active users
- Views
- Engagement rate
- Average engagement time
- Bounce rate
- Conversions
- Conversion rate
- Revenue
- Event value
- Event count
- Transactions
- Ecommerce purchases
Key Dimensions
- Page path
- Page title
- Source / Medium
- Campaign
- Channel group
- Device category
- Browser
- Country
- City
- Landing page
- Referrer
- Event name
View all Google Analytics 4 fields, metrics, and dimensions →
Resources & Guides
How to make marketing data AI-ready
Google Analytics 4 guide for marketers
Why Supermetrics for Claude?
The only native Claude connector with 170+ data sources, campaign management, and enterprise-grade security.

Native Claude Connector
One-click setup directly in Claude. No plugins to install, no terminal commands, no technical skills required. The first marketing data platform with native AI integrations.

170+ Data Sources
Connect Google Analytics 4 alongside 170+ other platforms through a single integration. Cross-channel analysis in one conversation.

Campaign Management
The only Claude integration with write access. Create, pause, and modify campaigns across Facebook Ads, Google Ads, Microsoft Ads, TikTok Ads, and LinkedIn Ads.

Enterprise Security
SOC 2 Type II certified. GDPR compliant. OAuth authentication. Your data is encrypted at rest and in transit.

Real-Time Data
No stale exports. Supermetrics pulls fresh data from Google Analytics 4 every time you ask Claude a question. Always current, always accurate.

Unsampled Data
Get your complete Google Analytics 4 dataset without sampling. Every session, every keyword, every page — full-fidelity data for accurate analysis.
Frequently Asked Questions
- Visit the Supermetrics connector page in the Claude directory (claude.ai/directory/connectors/supermetrics), click Connect, then authorize Google Analytics 4 as a data source. You can start querying your Google Analytics 4 data in natural language immediately — no code, no exports, no spreadsheets.
- Yes. Supermetrics uses OAuth-based authentication with your Google Analytics 4 credentials encrypted at rest and in transit. Data is only processed as needed to serve your queries. Supermetrics is SOC 2 Type II certified and GDPR compliant.
- Absolutely. Supermetrics connects 170+ data sources to Claude through a single integration. You can ask Claude to compare Google Analytics 4 performance against data from other platforms in the same conversation — for example, cross-referencing ad spend with revenue or web analytics.
- You can access all standard Google Analytics 4 reporting metrics through Supermetrics, including Sessions, Users, New users, Active users, Views, and more. Both metrics and dimensions are available, so you can slice data by campaign, date, audience, and other dimensions.
- No. The setup takes under two minutes with zero coding. The Supermetrics MCP server handles all the API connections, authentication, and data formatting behind the scenes. Just connect, authorize, and start asking questions in plain English.
- Yes. Supermetrics pulls all standard and custom events from GA4, including custom conversion events you have configured. You can query any event data in Claude.
- Yes. If you have multiple GA4 properties connected through Supermetrics, you can query and compare data across properties in a single conversation.
Also Connect to Claude
Ready to Connect Google Analytics 4 to Claude?
Join 200,000+ companies that use Supermetrics to connect their marketing data. Set up in under two minutes.