Mar 1, 2024
Automate ad spend tracking and budget pacing with Google Sheets and Supermetrics [Free cheat sheet and template included]
12-MINUTE READ | By Sofie Segercrantz
[ Updated Feb 29, 2024 ]
When I worked in an agency as a paid media consultant, ad spend and budget were some of the most often recurring discussions we had with clients.
I learned that some advertisers’ budgets are more strict than others. Whenever significant overspending or underspending occurs, it can cause real harm to the customer relationship and trust. Taking good care of the ad budget is paramount for any performance marketer—whether in-house or agency.
Keep reading to learn how I drink our own champagne and use Supermetrics and Google Sheets to automate budget pacing.
Skip ahead:
- Budget pacing is all about keeping the balance
- 11 metrics you should include in your budget pacing report
- How to automate budget pacing using Google Sheets and Supermetrics
- The most frequently asked questions about budget pacing
Budget pacing is all about keeping the balance
When you’re working in performance marketing and managing clients’ ad spend, it’s important to stay within the budget and avoid overspending or underspending.
Spending over budget is bad because you’re using the funds you don’t have and will probably need to reduce ad spend from a future budget. As a result, you’ll have less budget to support your campaigns in the following months.
On the other hand, not spending the full budget results in missing out on opportunities or conversions you could’ve achieved with the full spend. Additionally, it comes across as your current budget is too high, and your next one could be reduced.
As 80% of ads are bought programmatically and different platforms have different cost models, advertisers’ ad costs will fluctuate daily depending on several factors. Most advertisers also buy ads through several ad platforms, which makes keeping track of the ad spend developments across platforms even more difficult, as the costs are reported in each platform separately.
Building an automated budget tracker helps you efficiently manage your ad budgets to achieve optimal outcomes.
Key metrics you should include in a budget pacing report
The two most important building blocks of your budget pacing report are your budget and your current ad spend. Based on these two data points, you can calculate all the other metrics needed for a comprehensive budget pacing report, including:
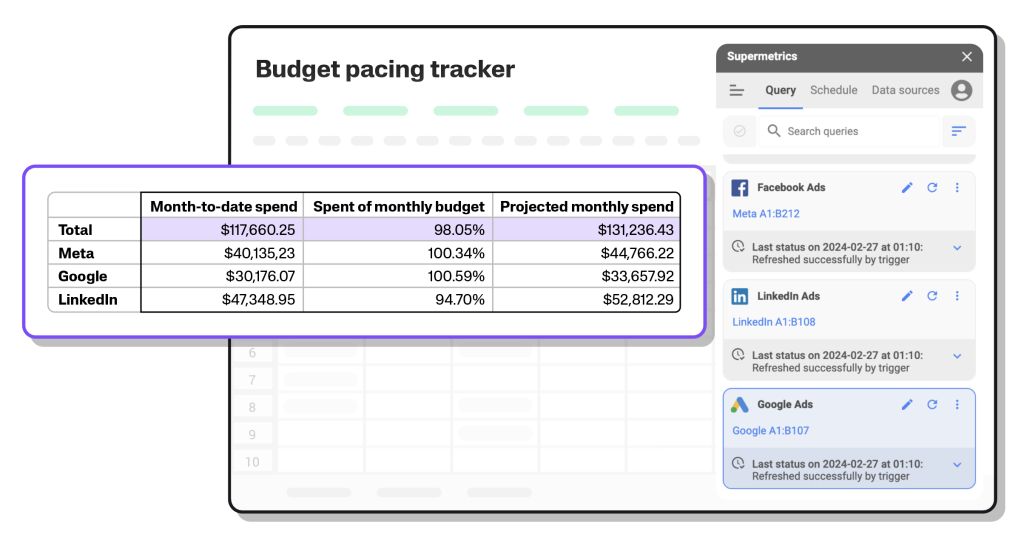
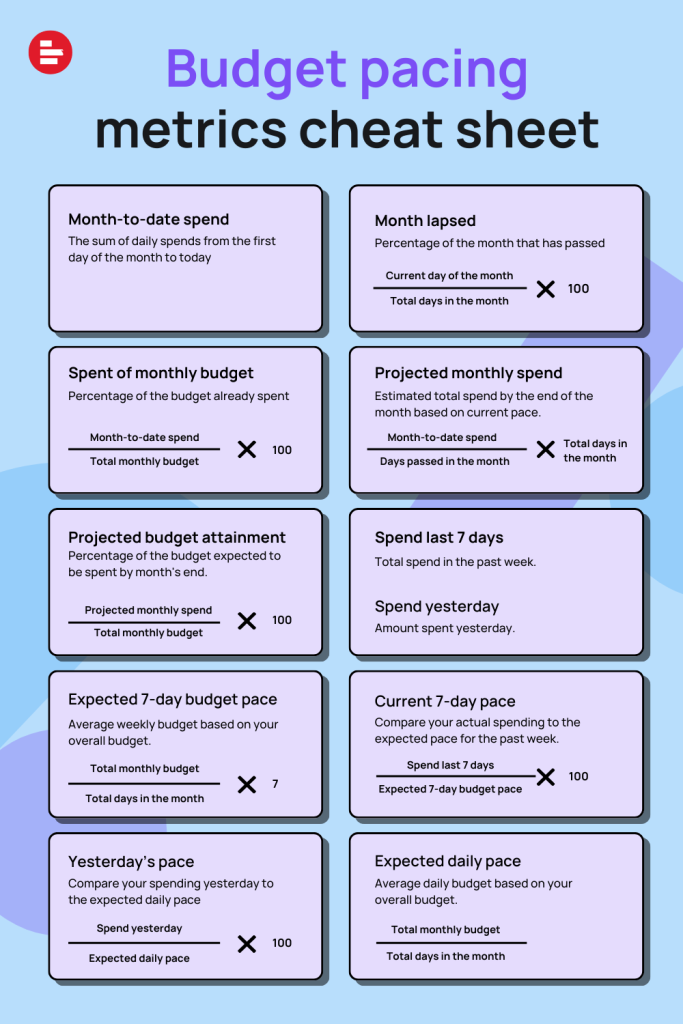
- Month-to-date spend: It’s the sum of daily spends from the first day of the month to today.
- Month lapsed: Percentage of the month that has passed.
- Spent of monthly budget: Percentage of the budget already spent.
- Projected monthly spend: Estimated total spend by the end of the month based on current pace.
- Projected budget attainment: Percentage of the budget expected to be spent by month’s end.
- Spend last 7 days: Total spend in the past week.
- Expected 7-day budget pace: Average weekly budget based on your overall budget.
- Current 7-day pace: Compare your actual spending to the expected pace for the past week.
- Spend yesterday: Amount spent yesterday.
- Expected daily pace: Average daily budget based on your overall budget.
- Yesterday’s pace: Compare your spending yesterday to the expected daily pace.
Let’s do some math together. For example, you’ve spent $500 of a $1200 monthly budget, and it’s currently the 15th of the month. This means you need to catch up and might need to adjust to spend the full budget this month, as you’ve spent 42% of your budget at 50% of the month.
Based on how much you’ve spent so far, you can predict the actual spend you’ll hit by the end of the month. If you keep this trajectory without any adjustments, your projected monthly spend will be $1000, with a budget attainment of 83%.
While it looks like you’re pacing behind the budget, it may not be what’s actually happening. This is because when doing budget pacing, you need to consider seasonality and mid-period changes, such as holidays and weekends, and campaign updates. That’s why I recommend calculating spend and pace for a few different time frames.
To continue on our example, out of the $500 you’ve spent so far, let’s say $350 was spent in the past week alone. As the expected weekly spend is $300, you’ll likely overspend without any adjustments. This scenario requires different actions.
How to set up an automated budget pacing report using Google Sheets and Supermetrics
Ideally, a budget pacing tool would always be up-to-date and require minimal management work. That’s where Supermetrics and Google Sheets come in handy.
With Supermetrics, you can automate ad spend data from different sources within a few clicks. You can also set up an automatic refresh to keep your report up-to-date. Meanwhile, Google Sheets is good for setting up formulas to calculate your pace and predicted spend.
Step 1: Collect data from different sources using Supermetrics
First, you need to install the Supermetrics add-on for Google Sheets.
Then, let’s open a new Google Sheet and launch the Supermetrics sidebar. Click ‘Extensions’, and select ‘Supermetrics’.
Once you’ve launched the sidebar, you’ll see a list of suggested queries for the most popular reports. In this case, we’ll start from scratch. You’ll need to do a few things to build your query:
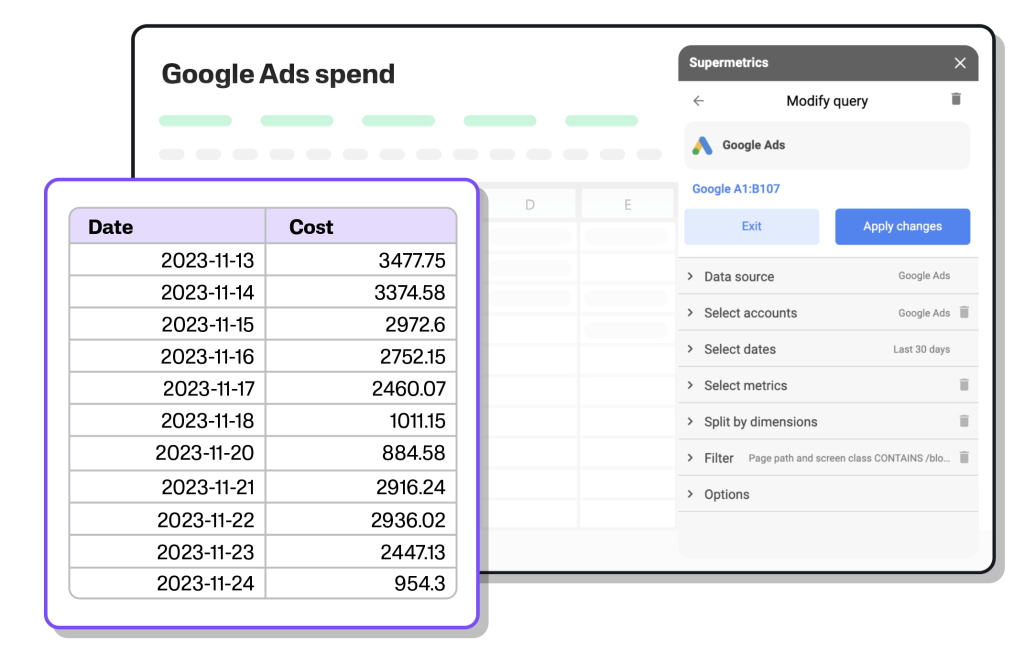
- Data source: select the ad platform you want to pull data from.
- Select account: enter your ad account.
- Select dates: choose how much data you want to bring in from what time.
- Metrics: depending on the platform, this can either be ‘Cost’ or ‘Amount Spent’.
- Dimension: select ‘Date’ as your row dimension and make sure to select enough rows from the dropdown.
- Filter: for this report, we won’t need any filters.
- Options: you want to select the following options:
- Replace blank metric values with zero.
- Show all time values.
- Combine new results with old.
- Keep previous results on refresh error.
Step 2: Use automatic refresh to keep the report up-to-date
Setting up automatic refreshes with Supermetrics for Google Sheets is easy — you go to the Schedule section of the add-on and click “Add trigger”. Then, you need to pick your preferred refresh schedule and time, and you’ll be all set.
Read more about setting up automatic refreshes.
Step 3: Set up Google Sheets formulas to calculate your metrics or use our free template
We’ve already discussed the metrics you should include in a budget pacing report, how to calculate them, and how to pull spend data into Google Sheets. If you’re familiar with Google Sheets functions and formulas, you can go ahead and set up your report. It can get messy really quickly if you have all your data in the same tab. To avoid it, I recommend you keep your ad spend and budget trackers on different tabs.
Alternatively, we’ve put together a template with all the necessary metrics and calculations to get you started right away.
To activate the template, open the file, and launch the Supermetrics sidebar. Click ‘Use template’.
Then connect and authorize data sources. Next, choose an account or accounts from which you want to pull data. Click ‘Get my data’.
After this, the template will fetch all your data in the report, ready for you to derive insights!
Watch a walkthrough of the budget pacing template.
Frequently asked questions about budget pacing
How often should I track and review my ad spend?
There are many levels to a budget and ad spend tracking—daily, weekly, monthly, quarterly, and annually.
Daily and weekly spend tracking is good for picking up on recent changes and trends in spending behavior, while monthly, quarterly, and annual levels are better for staying on track for the full budget period and balancing spend across seasonal ups and downs.
In my experience, a mix of weekly and monthly pacing works well, especially if your budgets are allocated monthly. Shorter periods will quickly show the most recent developments in your ad spend, while monthly and quarterly pacing helps keep track of the overall budget. At the end of the day, your budgeting and how flexible your budgeting is will determine what level of detail you should track.
How should I take seasonality into consideration?
It’s good to note that these predictions don’t consider any seasonality or variance between days of the week but assume every day in a month follows the same spending behavior. While this is rarely the case for any advertiser, it’s the easiest way to calculate these metrics. This limitation is also why we recommend calculating spend and pace for a few different time frames.
When adding weekly and even daily pace tracking to your monthly report, you’ll also see the effect of your most recent changes and be able to account for those when analyzing and planning changes to your ad budgets.
How do I account for time zone differences across multiple ad accounts?
This really depends on how many time zones the ad accounts are spread across and the size of the budget. If the ad accounts are only spread across a few different time zones, I’d take it into account when scheduling the daily refresh to try to capture the full data up until yesterday. For example, if you’re in London, UK, but your ad account is set to Los Angeles, US, you could set your query to update after 8 a.m., to capture the full spend from the past day.
If there’s a lot of different time zones to account for and/or a high daily spend, I’d recommend using hourly refreshes. This will ensure your budget tracker is nearly real-time and mitigate most time zone differences.
Can I get more granular than budget pacing on the ad account/channel level? For example, only contain a specific campaign name per channel (ie. excluding non-relevant spend)?
Yes, you create an ad spend tracker that only includes selected ad campaigns around a particular theme or product. It’s a good idea to track a big launch or campaign separately from your always-on activities.
When you set up your Supermetrics query in Google Sheets, you can add filters to narrow down your data. You just need to have something to filter by, like a campaign name. The more rigorous naming convention you have in place, the easier time you’ll have when filtering. As you’re limiting your data, I recommend doing some sanity-checking when creating your setup.
You can do this by adding the campaign names as a dimension in your query to see if everything is included. Another way is to compare the daily numbers in your file to the ad platform numbers. Also, consider your filtering if you start any new campaigns later.
Over to you
Now that you know the basics of budget pacing and how to automate your tracker using Google Sheets and Supermetrics, it’s time to put everything you learn into practice. Whether you’re confident with your Google Sheets skills and build your own report or use our pre-made template, I hope it’ll help you stay on top of your ad spend.
Happy budget tracking!
About the author

Sofie Segercrantz
Sofie is the Head of Performance Marketing at Supermetrics. She oversees and ensures we effectively reach the right audiences and grow the business through paid media. Before joining Supermetrics, Sofie works at Tulos. She led her team to top Google quality and product adoption rankings, securing the Google Premier Partner and Bing Ads Partner statuses. Her leadership contributed to winning the Google Partners’ Ready to Rock Award in 2016. Sofie excels in mentoring, focusing on developing her team's skills in advertising and analytics to deliver exceptional client service.
Turn your marketing data into opportunity
We streamline your marketing data so you can focus on the insights.