Supermetrics Charts for Looker Studio
Introducing Supermetrics Charts
Watch this video to get a better idea how these charts can help you every day.

Benefits of using Supermetrics Charts
Get Supermetrics Charts today
Only one subscription is required to use Supermetrics Charts on all your packages. If you are subscribed to a Google Sheets or Enterprise package, please contact our support team or your customer success manager to assist in getting access.
Available chart types
View a selection of available charts included in our library, the complete list of all charts is available on our support site.
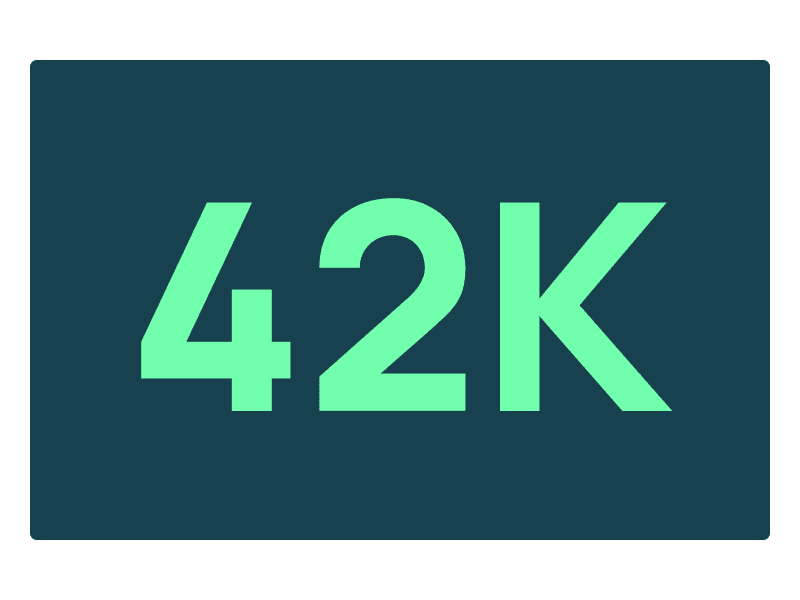
Combo scorecards
Present a single KPI or multiple key metrics and compare it to another time frame or another metric.
View Demo Report
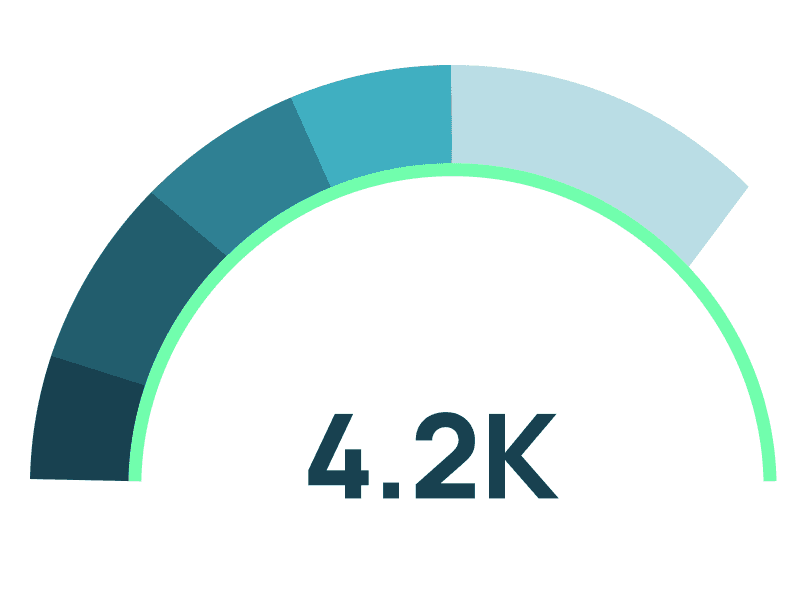
Gauges and progress bars
Easily compare single or multiple metrics to targets or a comparison date range.
View Demo Report
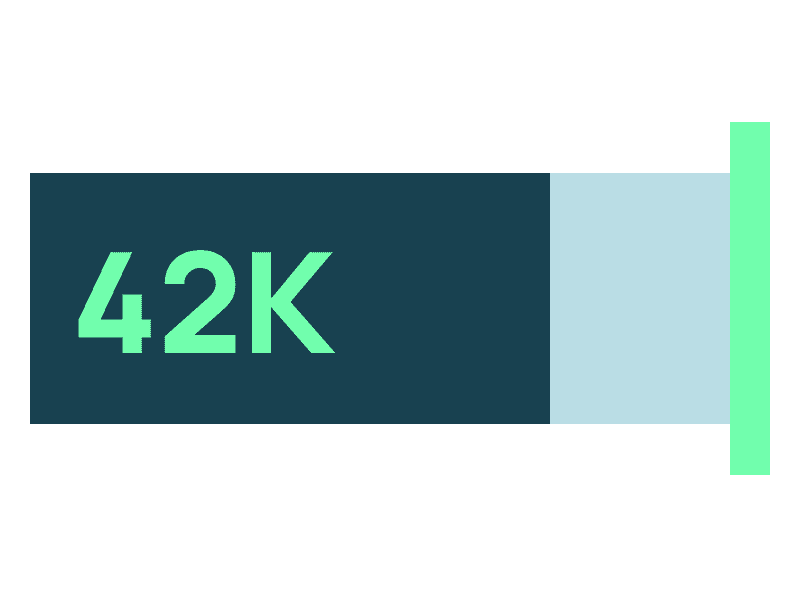
Bullet graphs
Compare a single KPI to a target or to another time frame.
View Demo Report

User Journey
Discover how users navigate your website or find the spots where your funnel fails.
View Demo Report
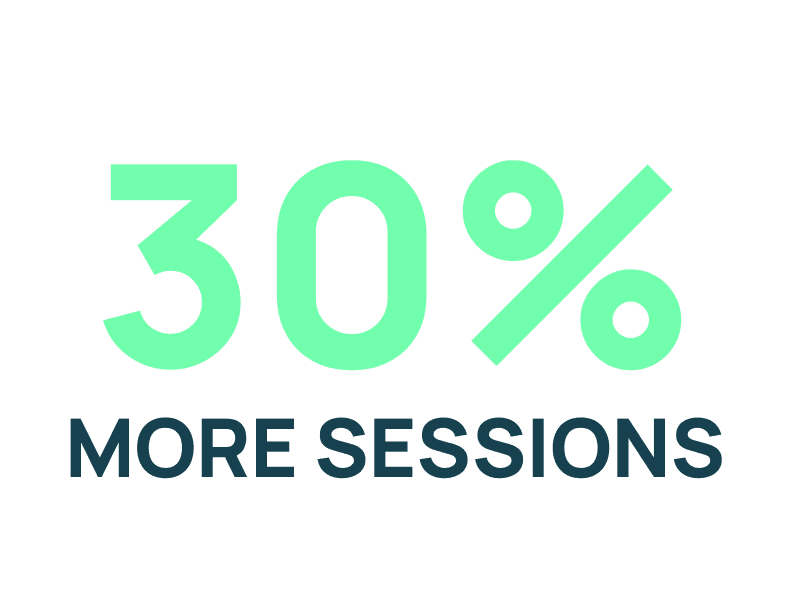
Tell Me
Enhance your reports with simple, dynamic, data-driven sentences or text snippets, and tell your readers the main takeaway from a report in one sentence.
View Demo Report

Tile grid map
Build your own tile grid map and compare your metrics across regions or countries.
View Demo Report
Popular blog posts
Take a deep dive and read about the features and advantages of Supermetrics Charts.
Frequently asked questions about Supermetrics Charts
Supermetrics helps you move your marketing data to your favorite reporting, storage, and data visualization platforms. This means you can keep analyzing data and building reports using the tools and software you already know and love.
Stay in the loop with our newsletter
Be the first to hear about product updates and marketing data tips