Visualize, compare, and optimize your Microsoft Ads and Google Ads performance with this Excel dashboard template. Get insights into cost efficiency, revenue impact, and return on ad spend with detailed visualizations and filters.
Get Microsoft Ads and Google Ads data into Excel in simple steps
Navigate to the “Data” tab in the top panel and choose "Show Supermetrics" at the right end of the panel.
Authenticate to all data sources in the list and select the accounts you want to use, then click "Run queries".
After queries have been successfully run, close the Supermetrics sidebar.
Important: Under "Data" in the top panel, click "Refresh All" to refresh all pivot tables and charts in the document. This will be done automatically anytime the document is opened.
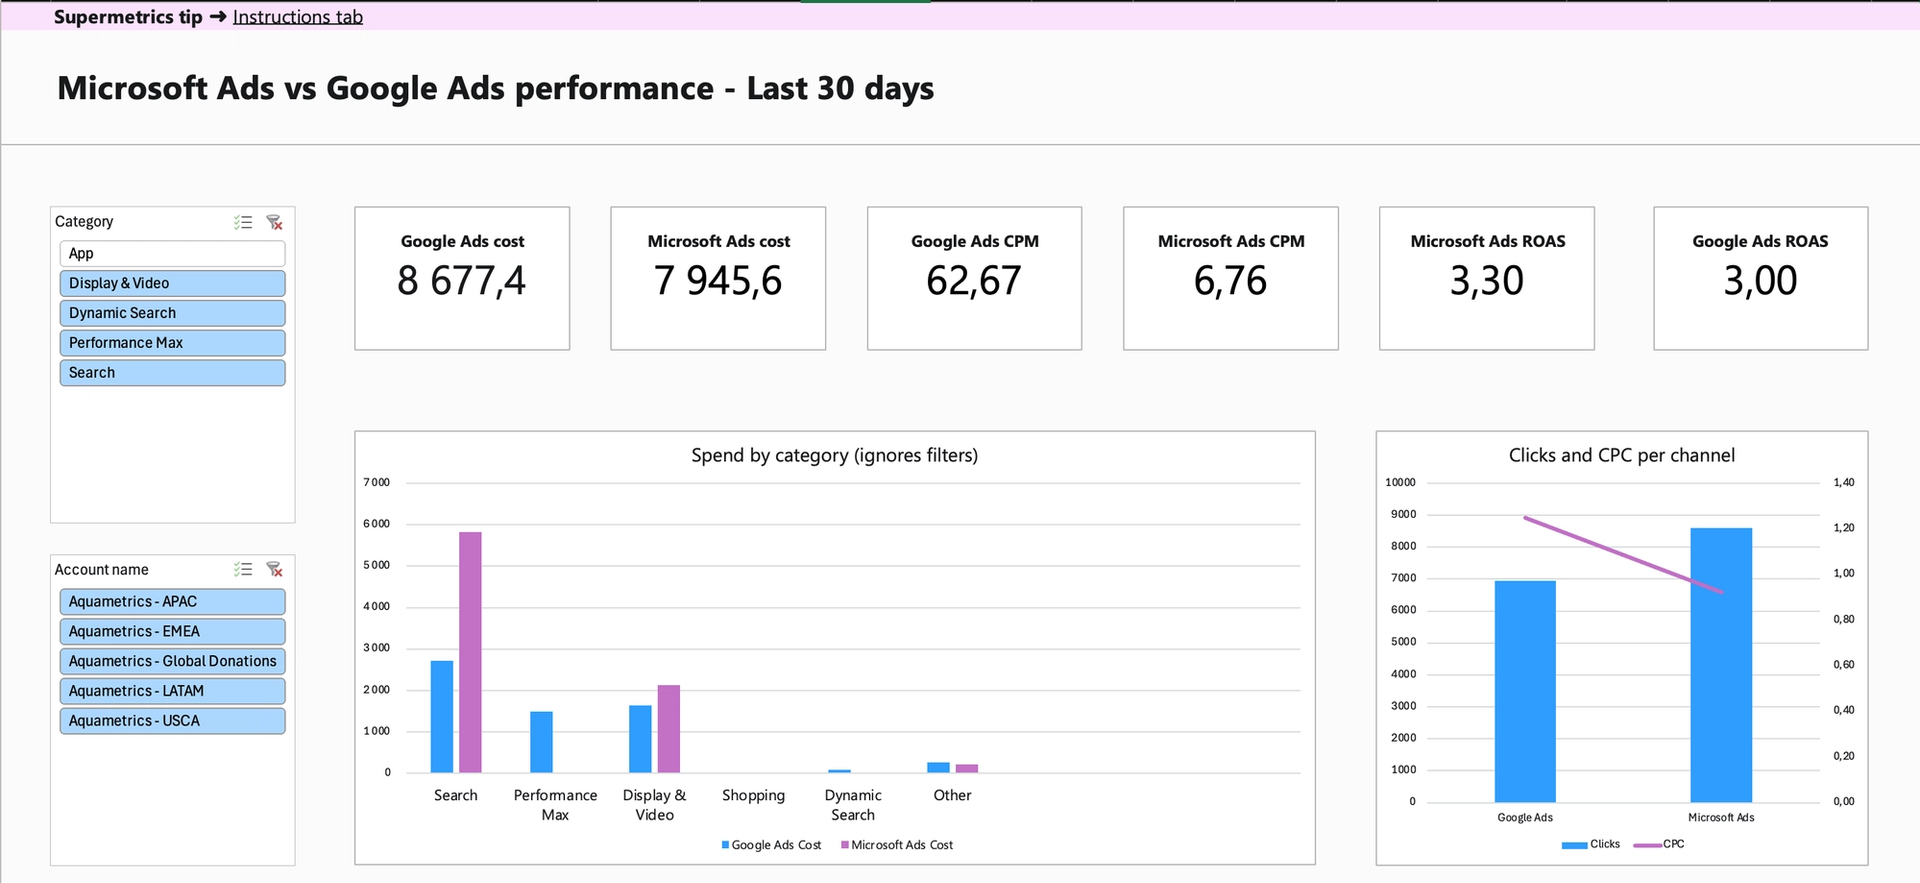
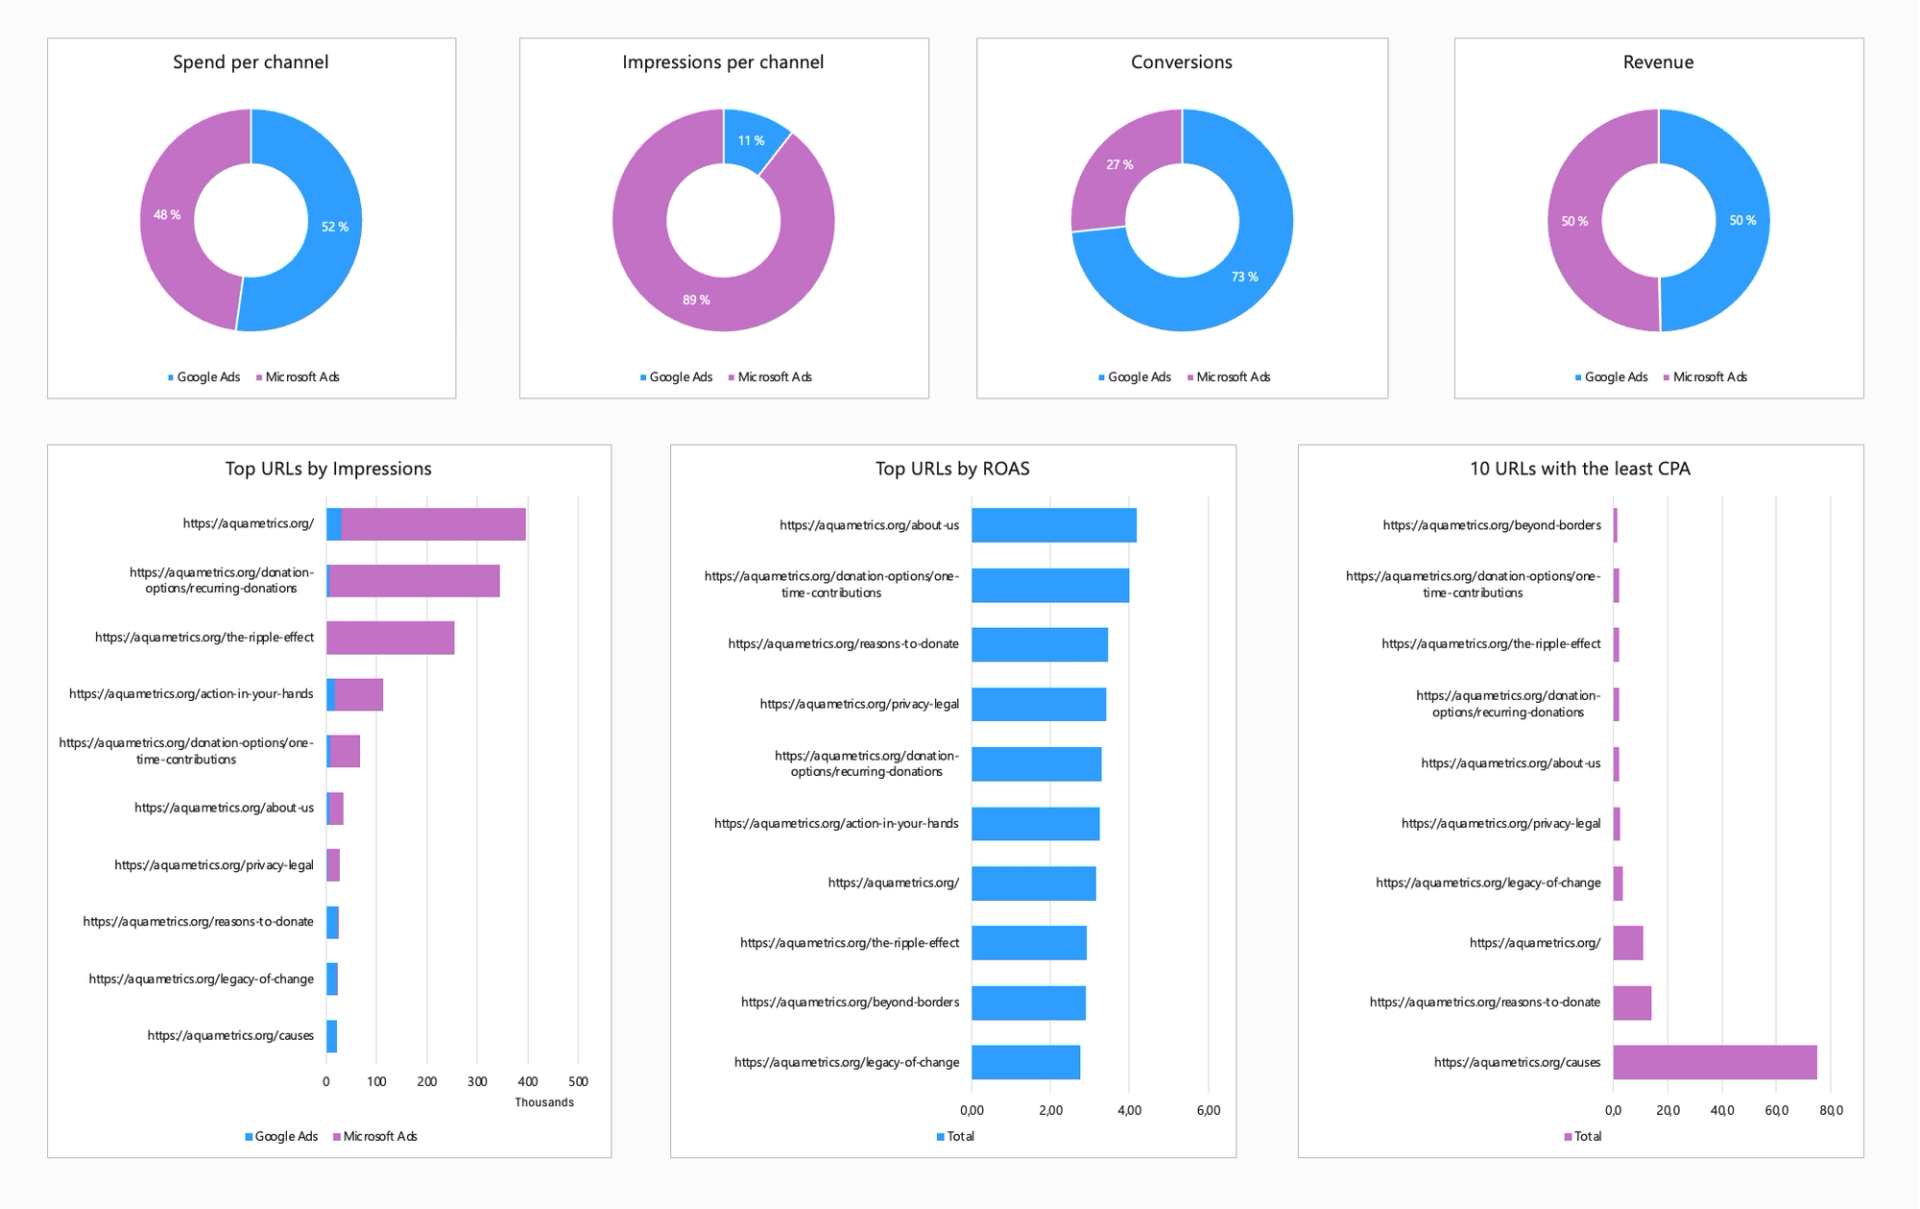
Which platform delivers higher total conversions and revenue?
How do CTR and CPC compare between Google and Microsoft Ads?
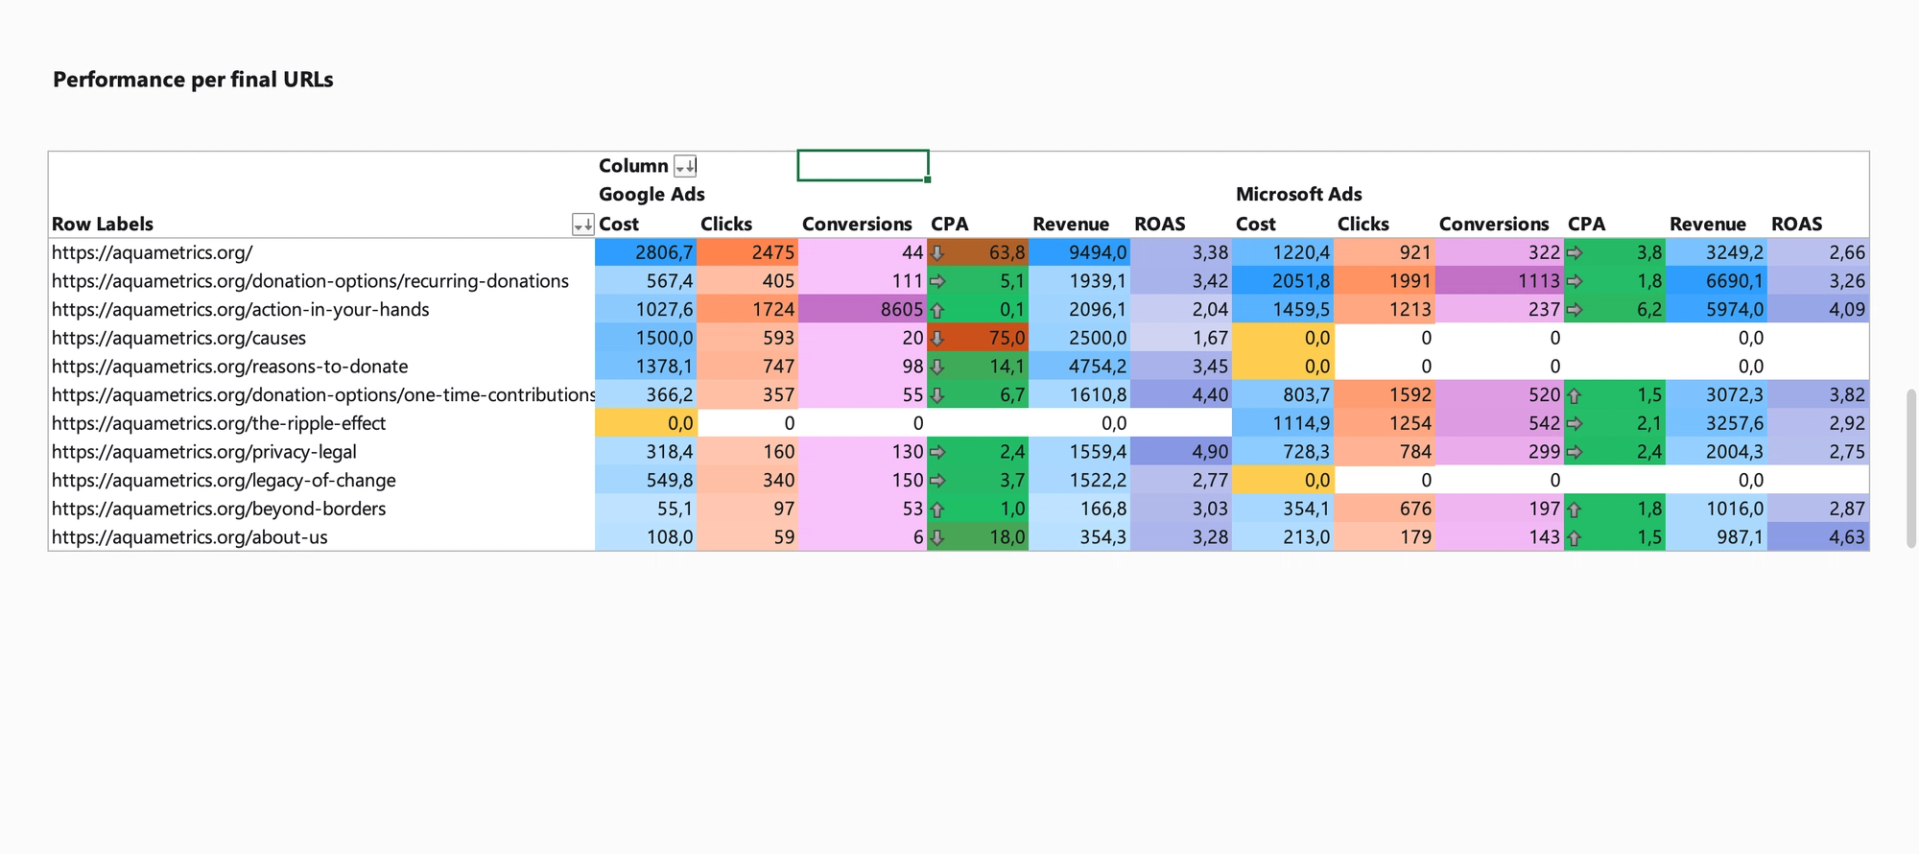
Which campaigns perform best on each platform?
Which channel offers the lowest CPA and highest ROAS?
How can budget reallocation improve ROI across platforms?
What is the revenue impact per dollar spent?
Which campaigns perform best by region or category?
How do device types affect conversion rates across channels?
Where do engagement and cost efficiencies overlap?
How does ad performance evolve over time by channel?
Are there trends in conversions, clicks, or impressions that signal opportunities for optimization?
Which campaigns show consistent growth or decline?
Compare and optimize your Microsoft Ads and Google Ads performance
Save time on cross-channel reporting, get clear insights, and reallocate your budget where it matters most. Gain full visibility into your paid search efficiency and ROI in a single dashboard.
“Supermetrics helped us close a new 7-figure client thanks to our data warehouse offering. Along with thousands of hours in time savings, combining Supermetrics for Google Sheets and BigQuery has transformed our analytical capabilities.”
Tim Haag
Analytics Director at Mindgruve
“Collecting data from fragmented data sources is something we struggle with everyday and this is something Supermetrics helps us with this.”
Jesse Korhonen
Insights Analyst at TBWA
“Before Supermetrics we could only work on 50% fewer projects. Now we’ve been able to double our client base and it’s given us the possibility to scale our business faster and in a more structured way. Without Supermetrics, it would have been very difficult for us to be this successful.”


 Tim HaagAnalytics Director at Mindgruve
 Jesse KorhonenInsights Analyst at TBWA
 Vicken SayrinFounder and Director at VS Com agency


