Get Google Analytics 4 data and export the data into Power BI in 4 simple steps
Log in to Supermetrics Hub. If new to Supermetrics, connect to your data source via the Power BI page on Supermetrics Hub.
Select and authenticate the data source for your template.
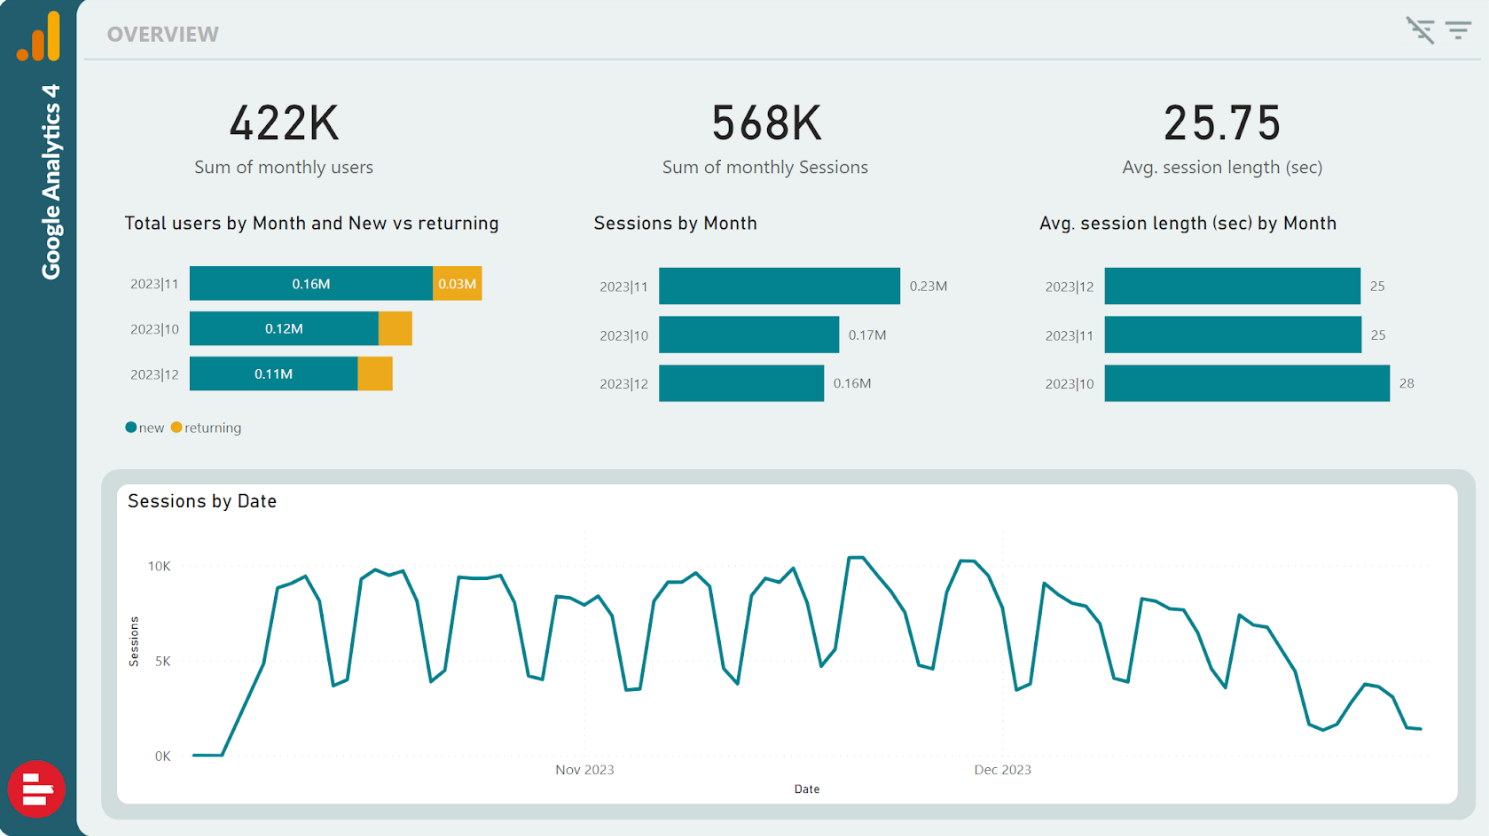
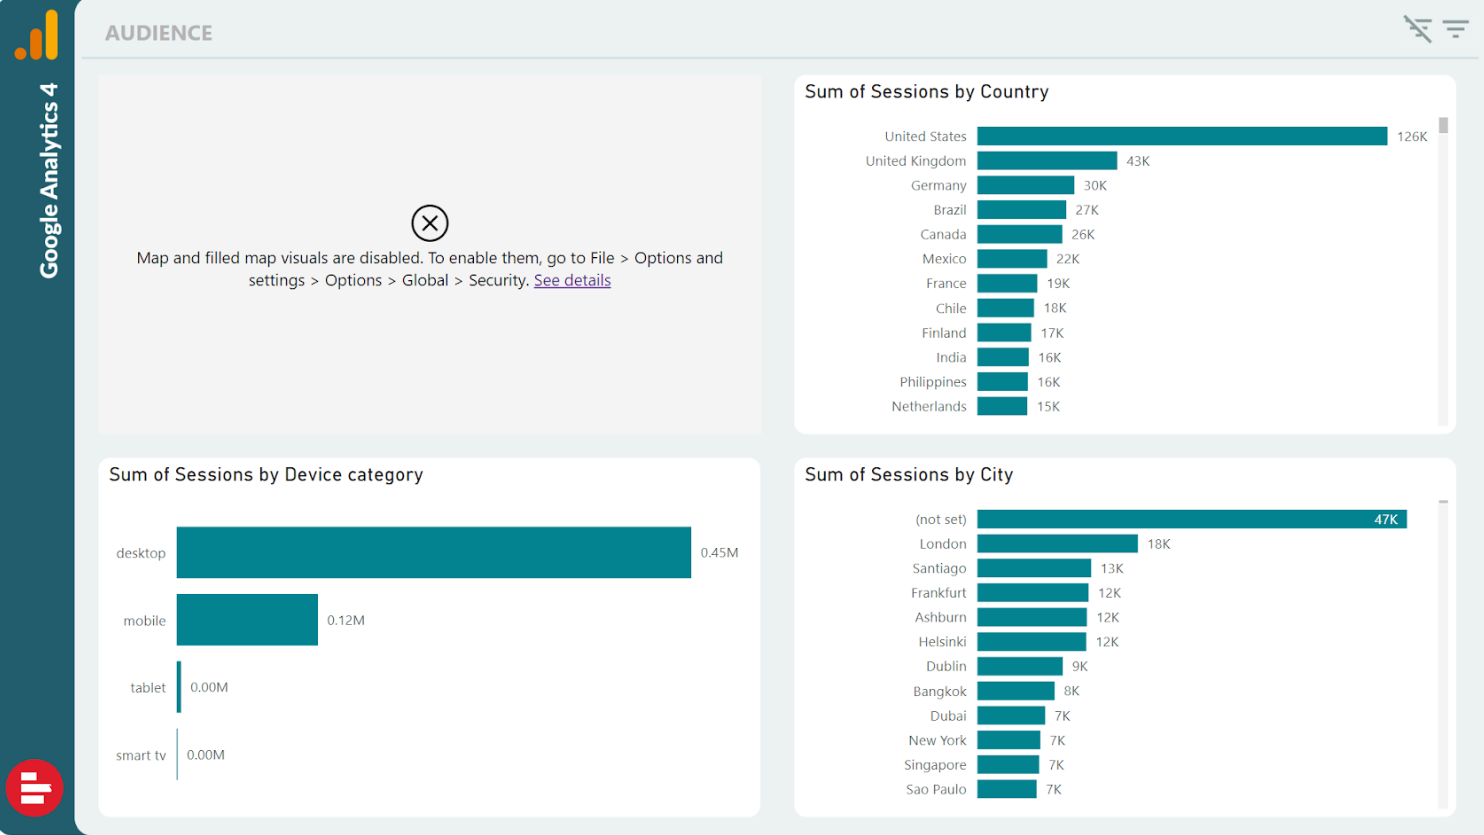
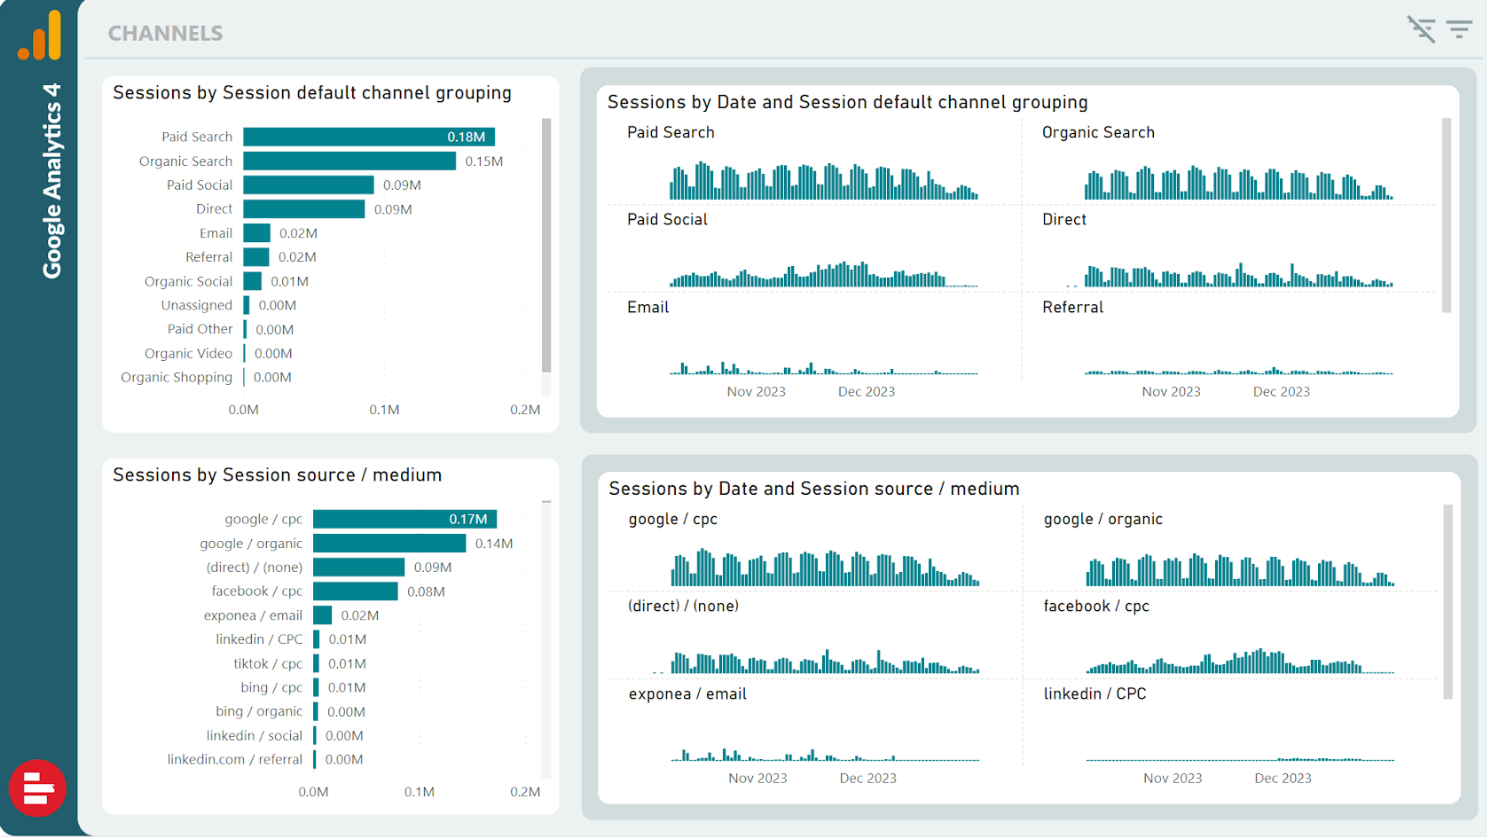
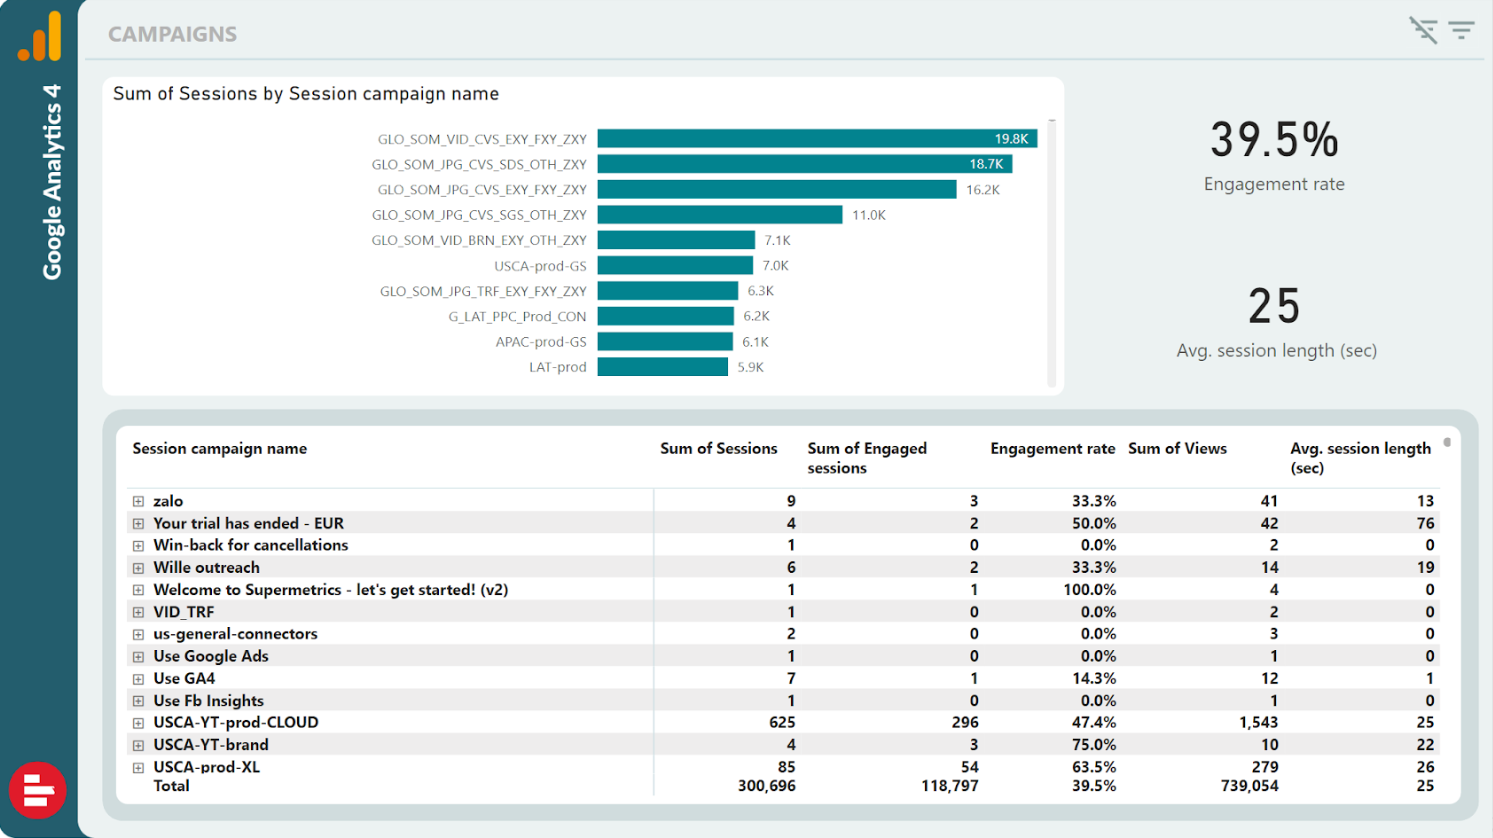
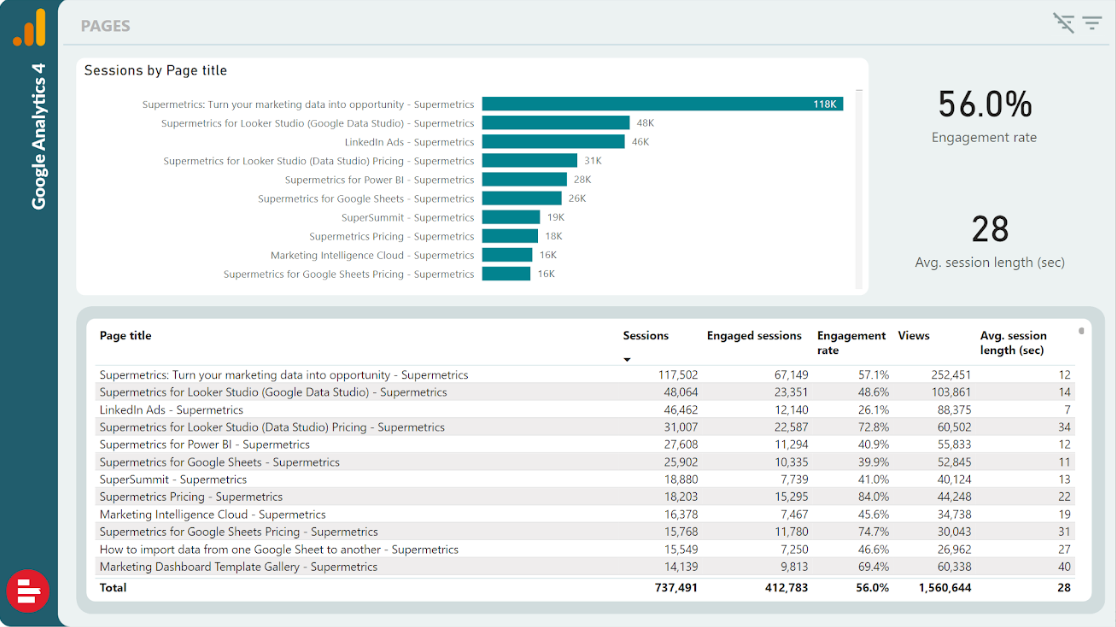
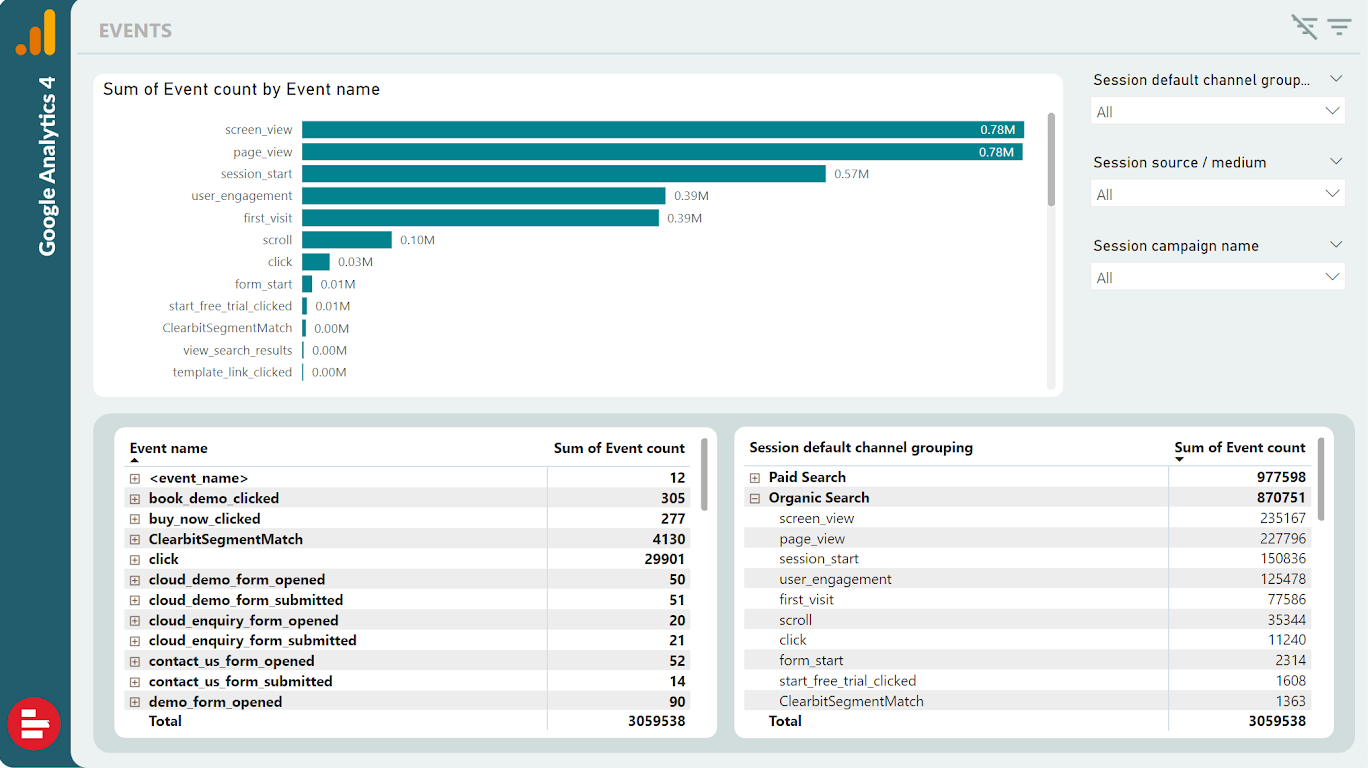
Download and open the template in Power BI. Sign in if prompted. The template will automatically fetch and display your data.
Change accounts (if needed). Open Query Editor in Power BI Desktop by clicking 'Transform data.' Modify the account settings in the Invoked Function step for each relevant table.
“Supermetrics helped us close a new 7-figure client thanks to our data warehouse offering. Along with thousands of hours in time savings, combining Supermetrics for Google Sheets and BigQuery has transformed our analytical capabilities.”
Tim Haag
Analytics Director at Mindgruve
“Collecting data from fragmented data sources is something we struggle with everyday and this is something Supermetrics helps us with this.”
Jesse Korhonen
Insights Analyst at TBWA
“Before Supermetrics we could only work on 50% fewer projects. Now we’ve been able to double our client base and it’s given us the possibility to scale our business faster and in a more structured way. Without Supermetrics, it would have been very difficult for us to be this successful.”


 Tim HaagAnalytics Director at Mindgruve
 Jesse KorhonenInsights Analyst at TBWA
 Vicken SayrinFounder and Director at VS Com agency

