Ad report template for Looker Studio (via BigQuery or Supermetrics Storage)
Use cases
Paid media
Social media
Data sources
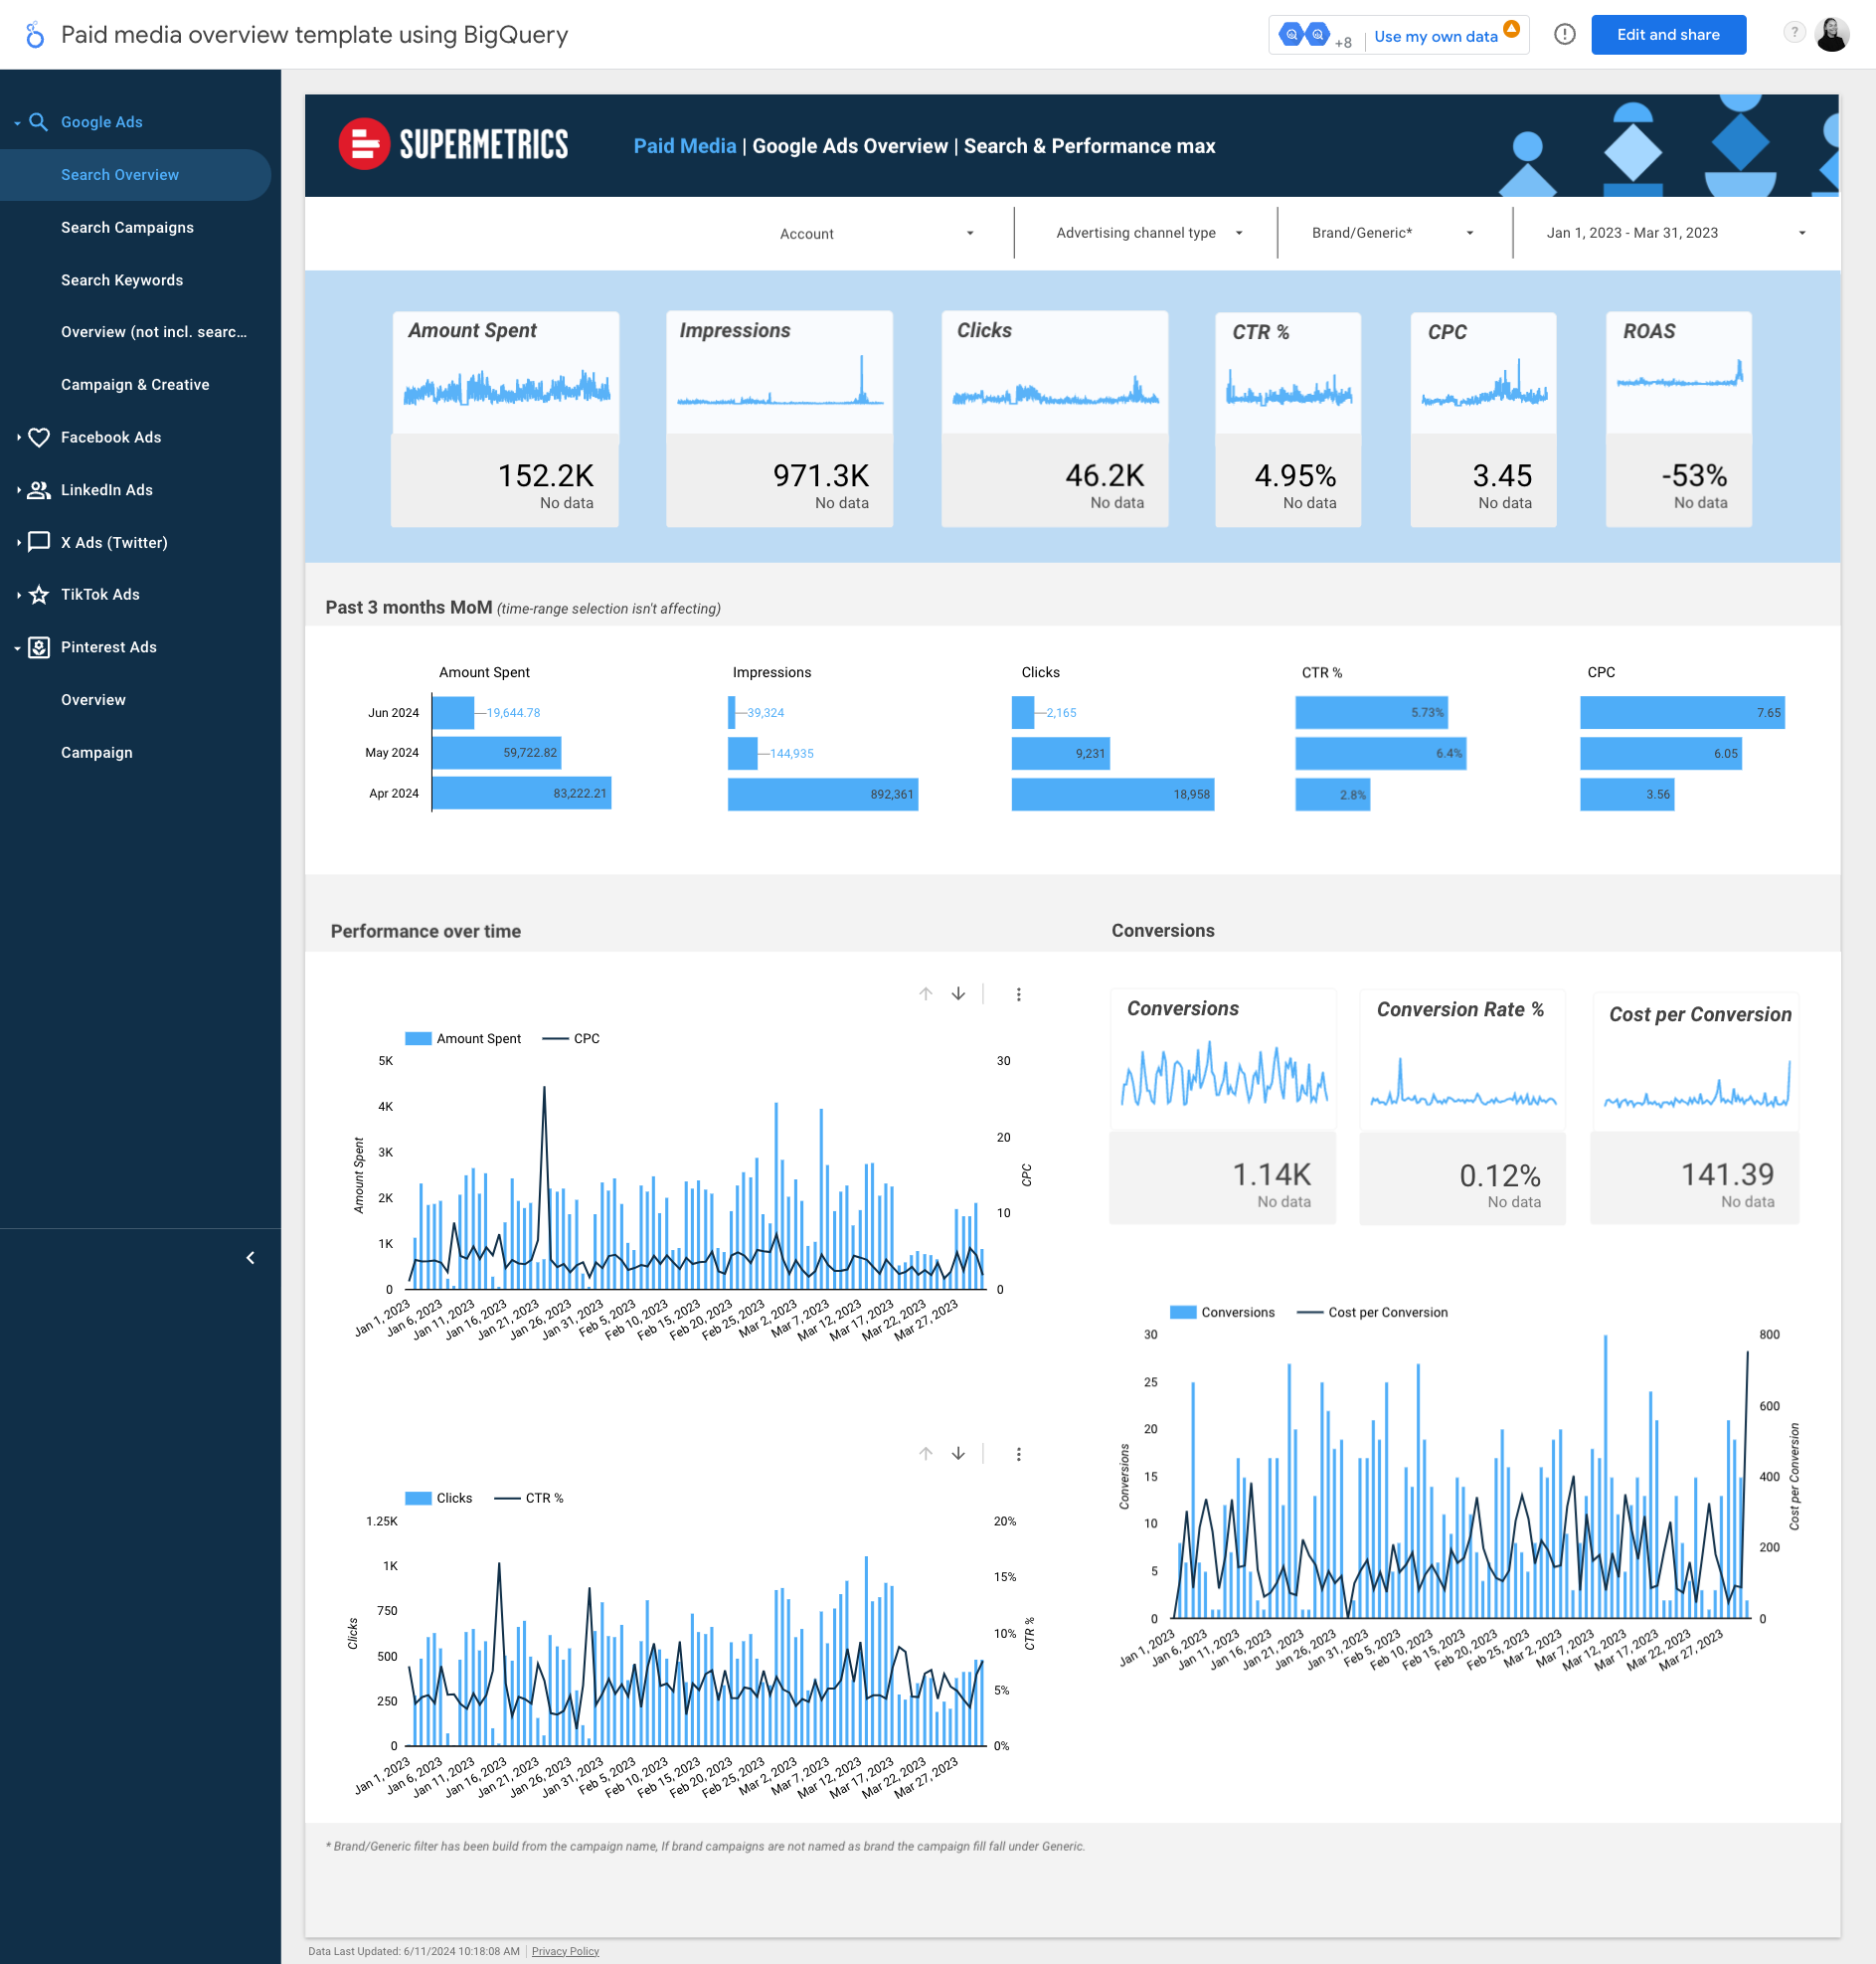
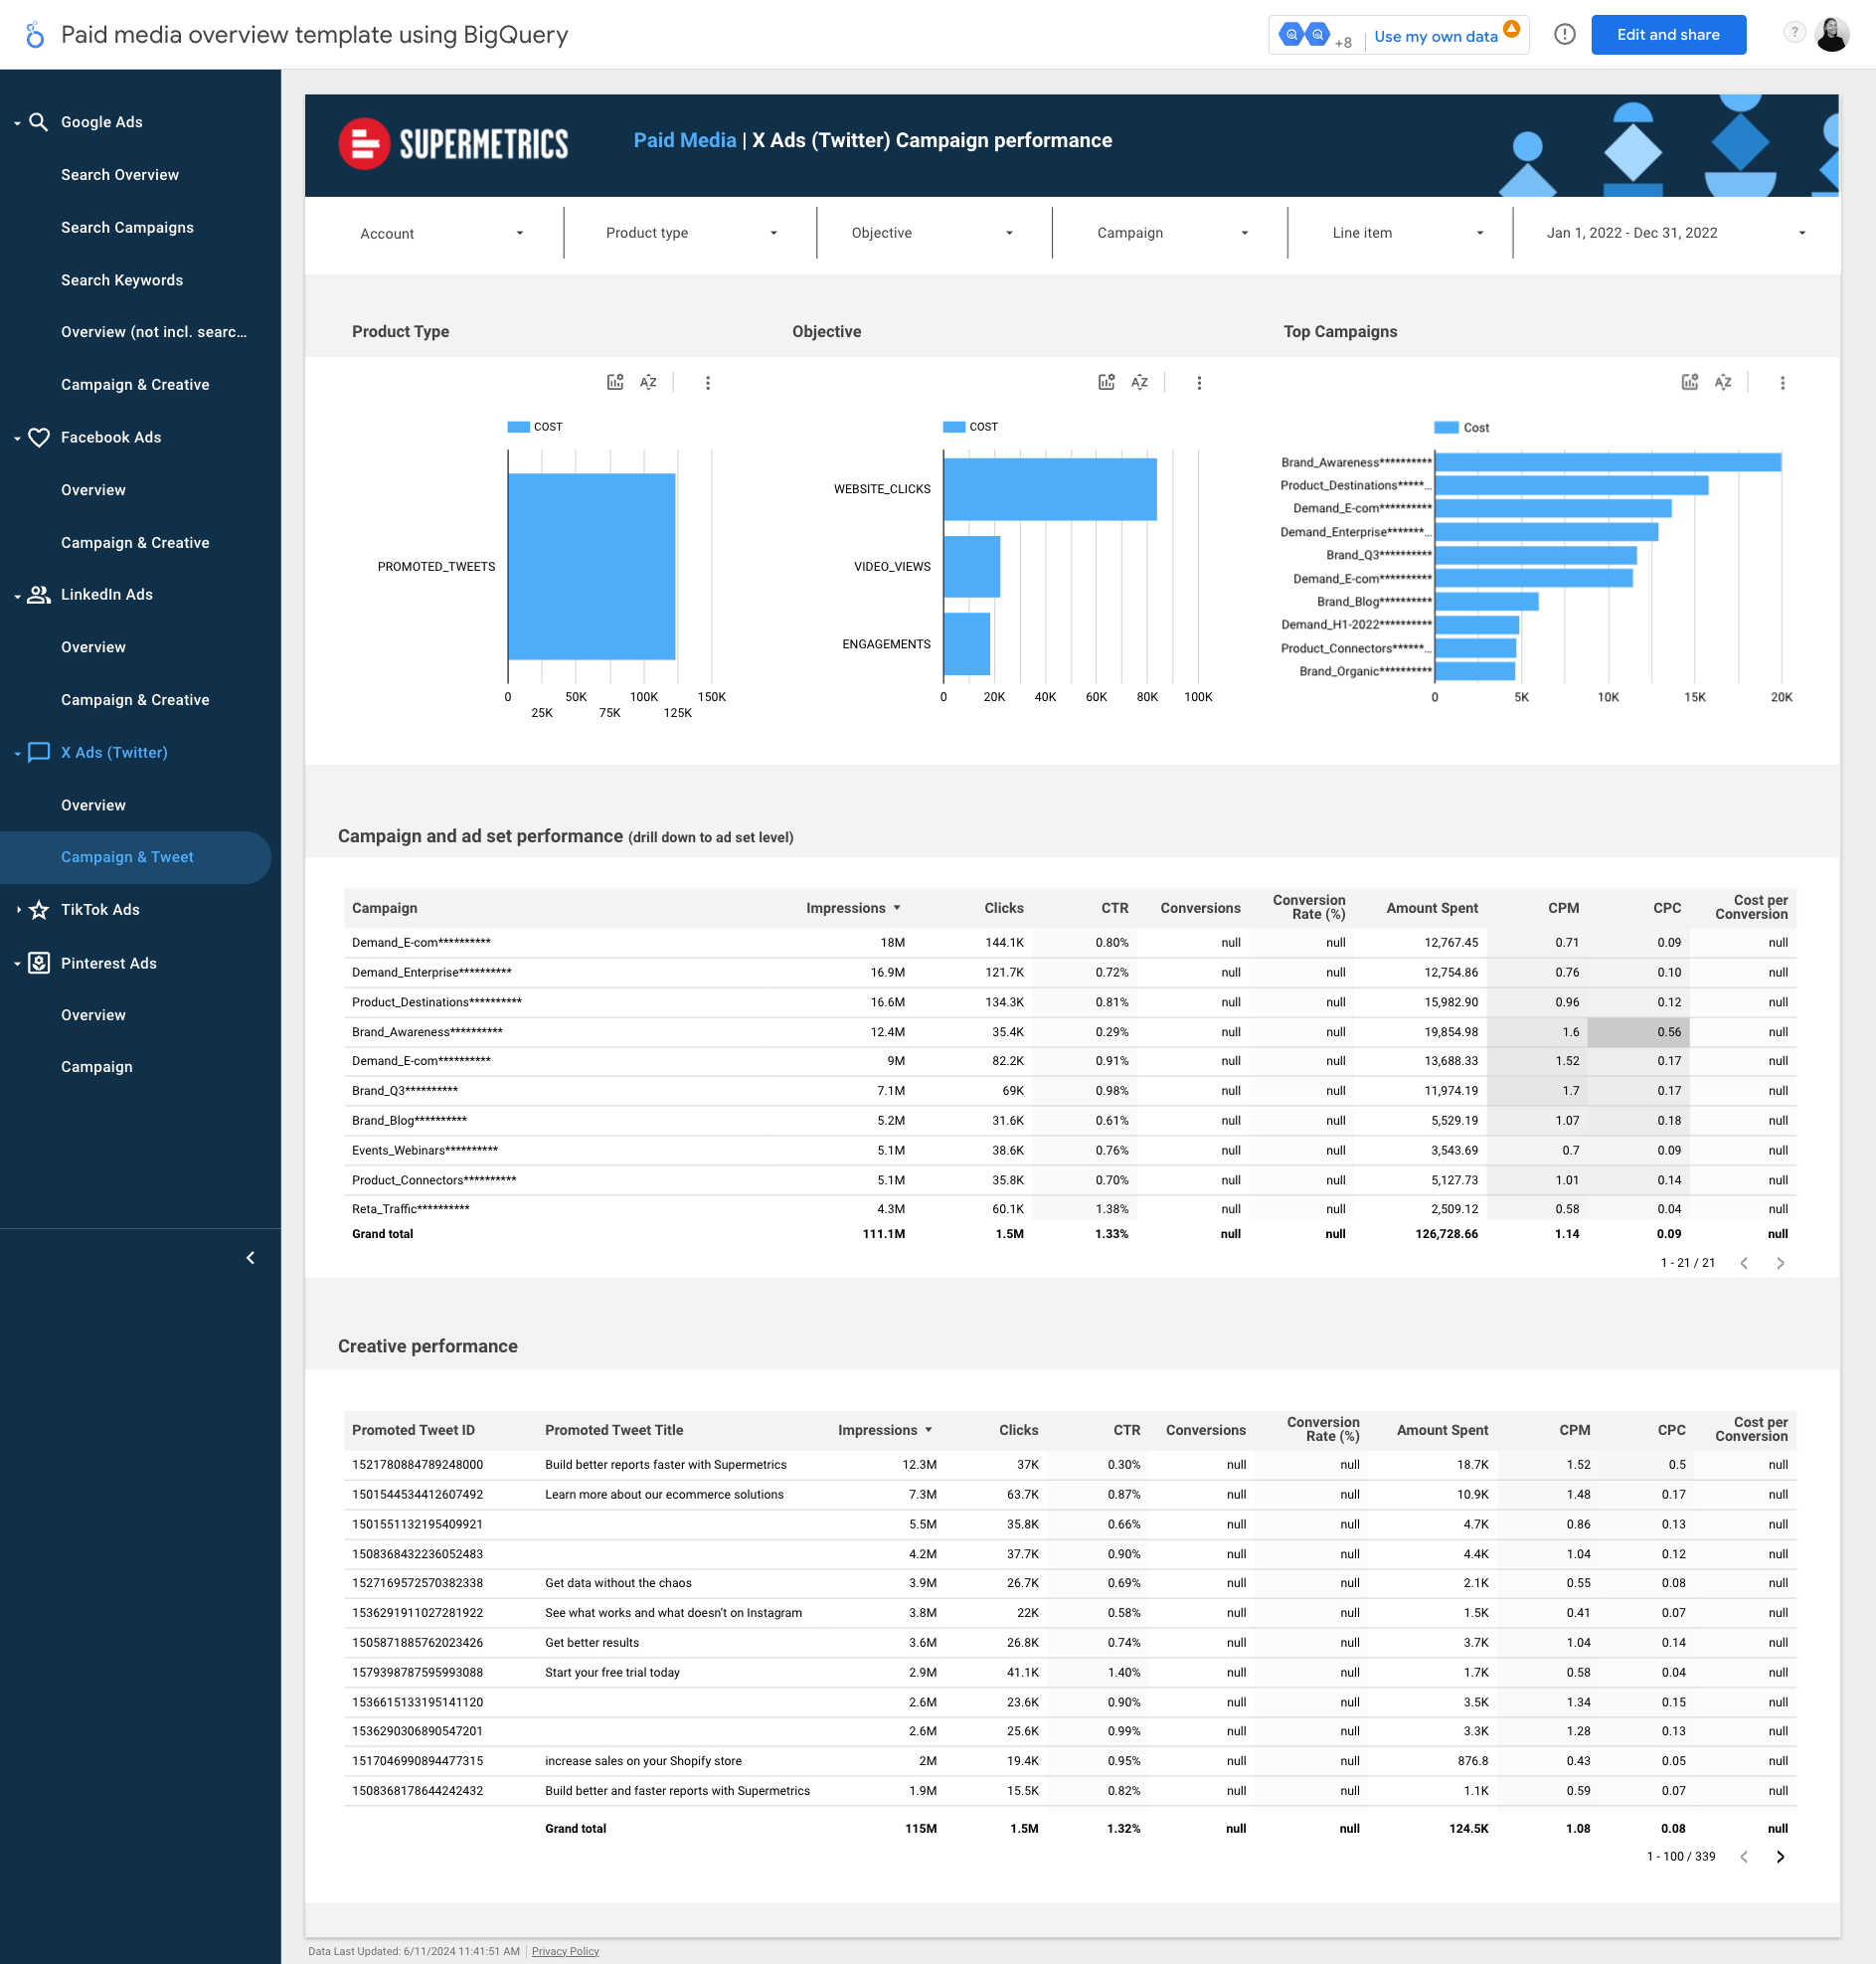
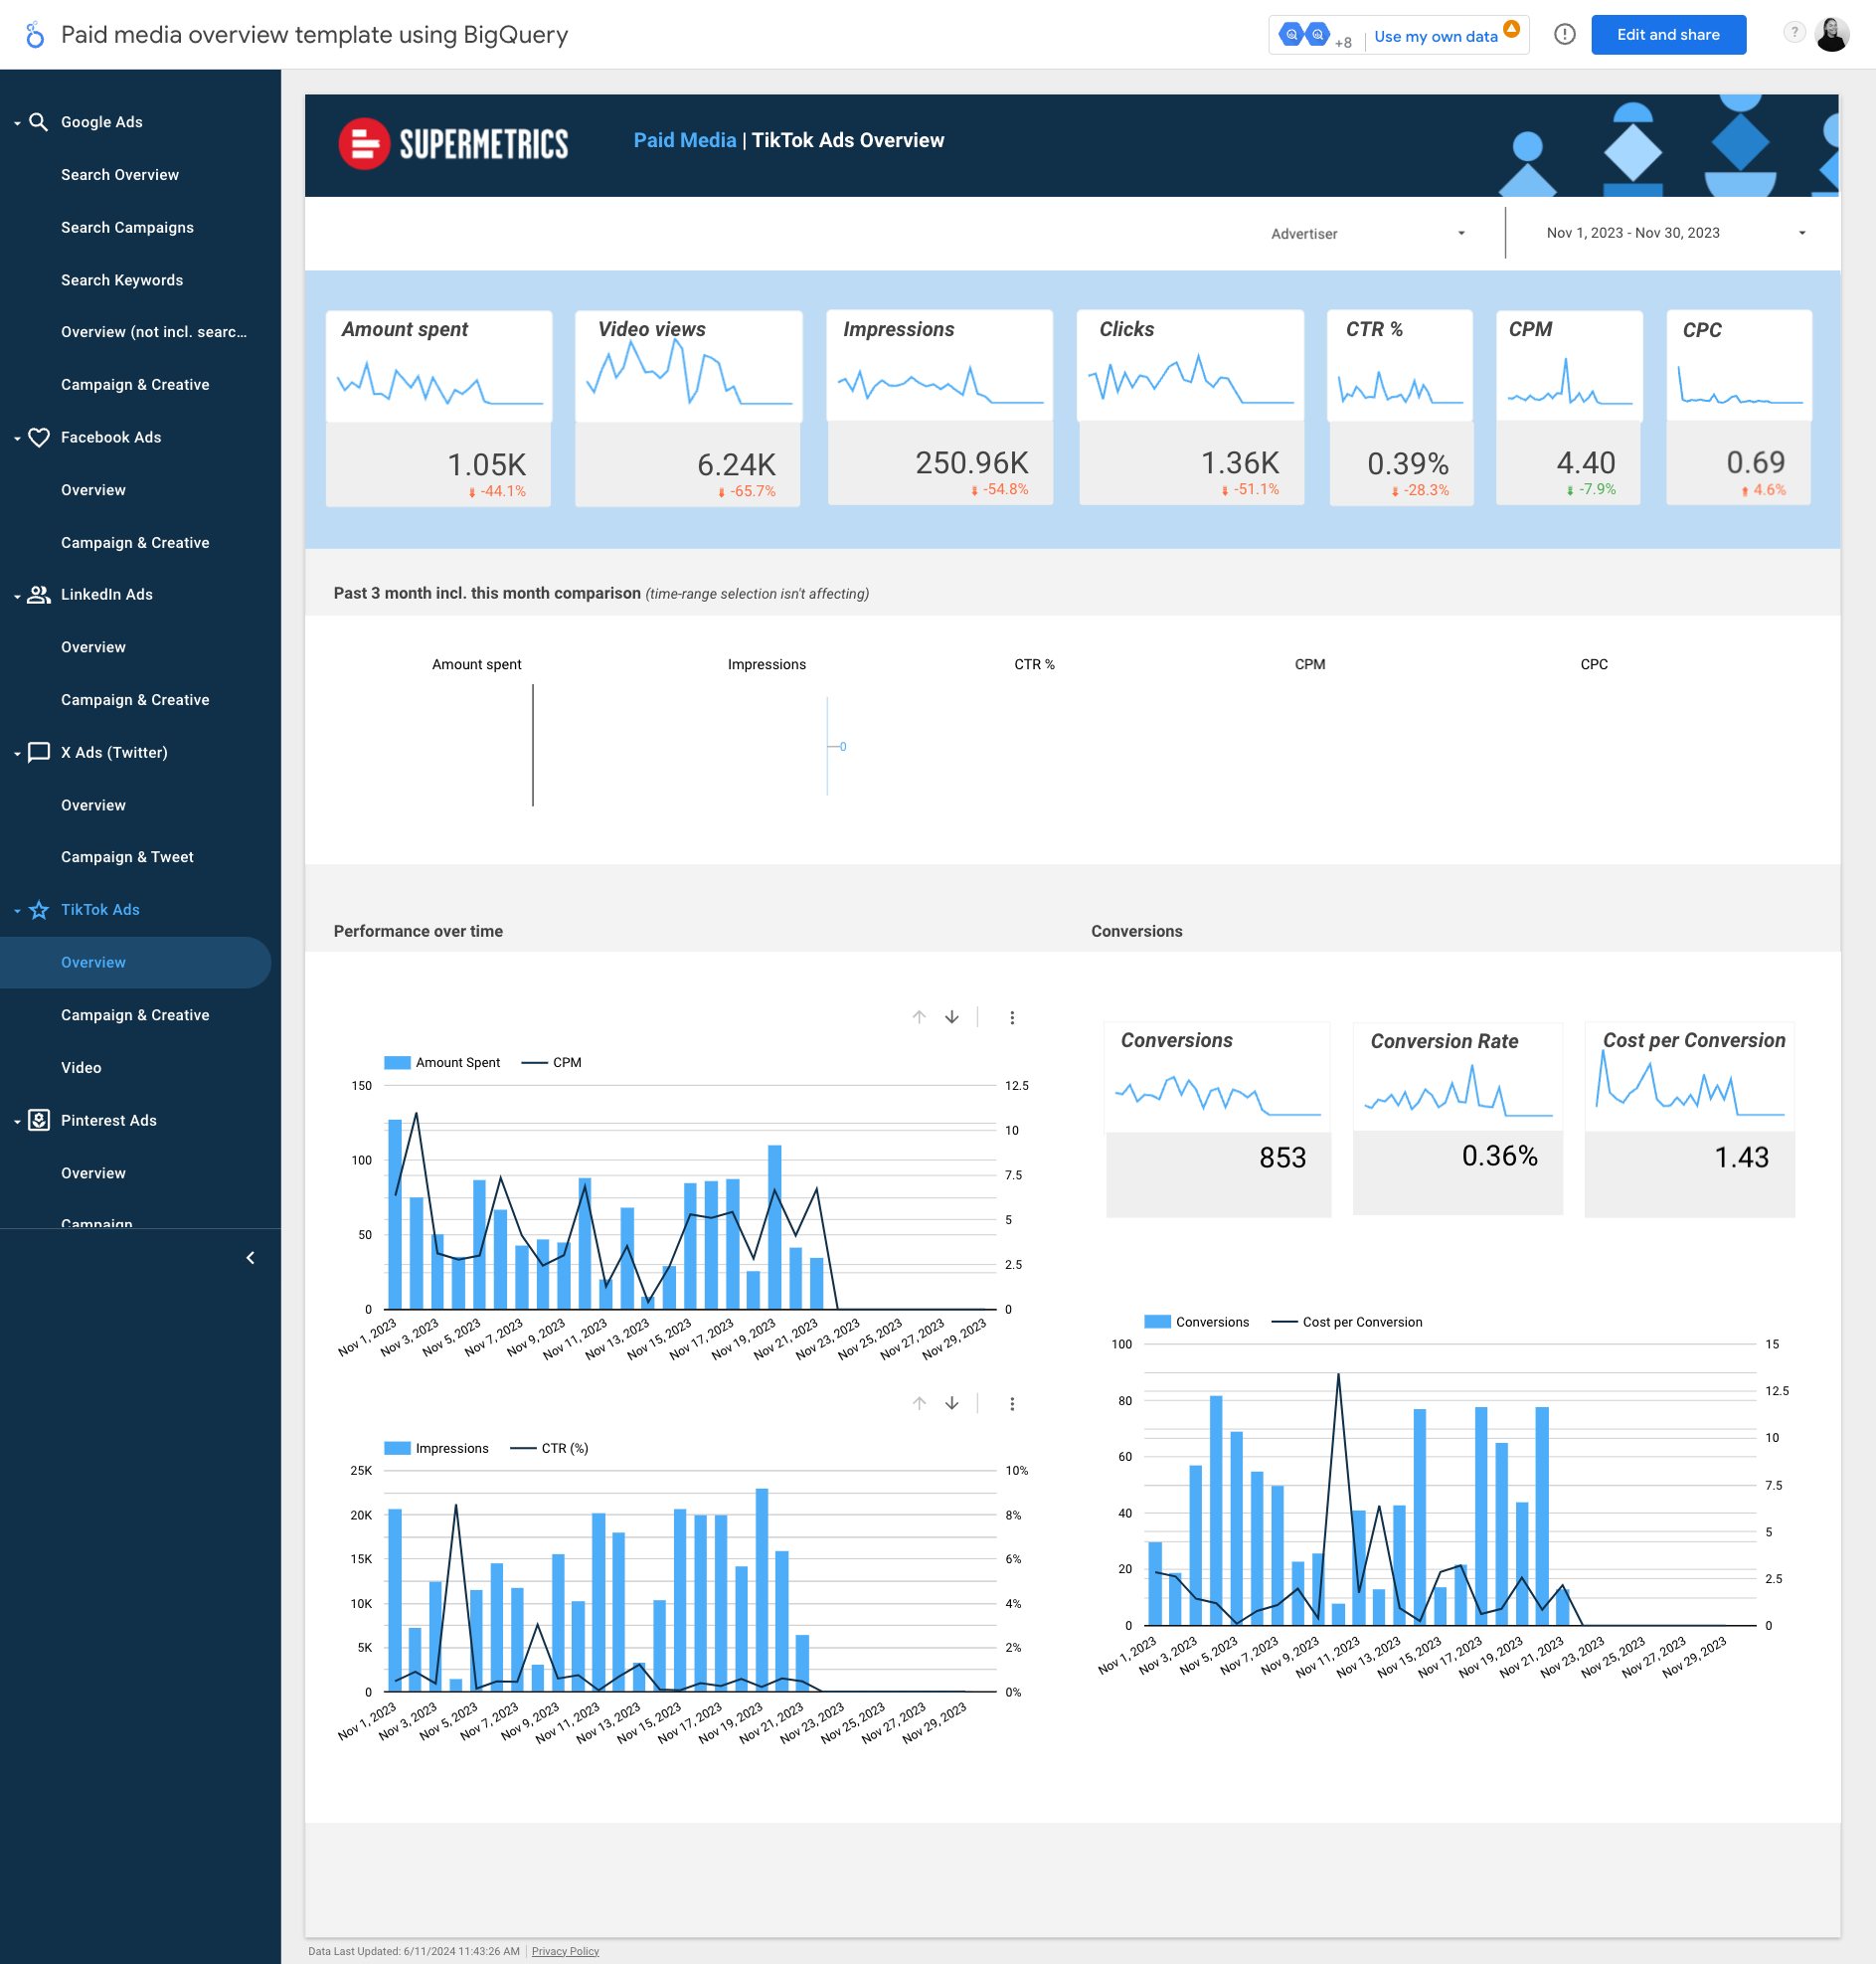
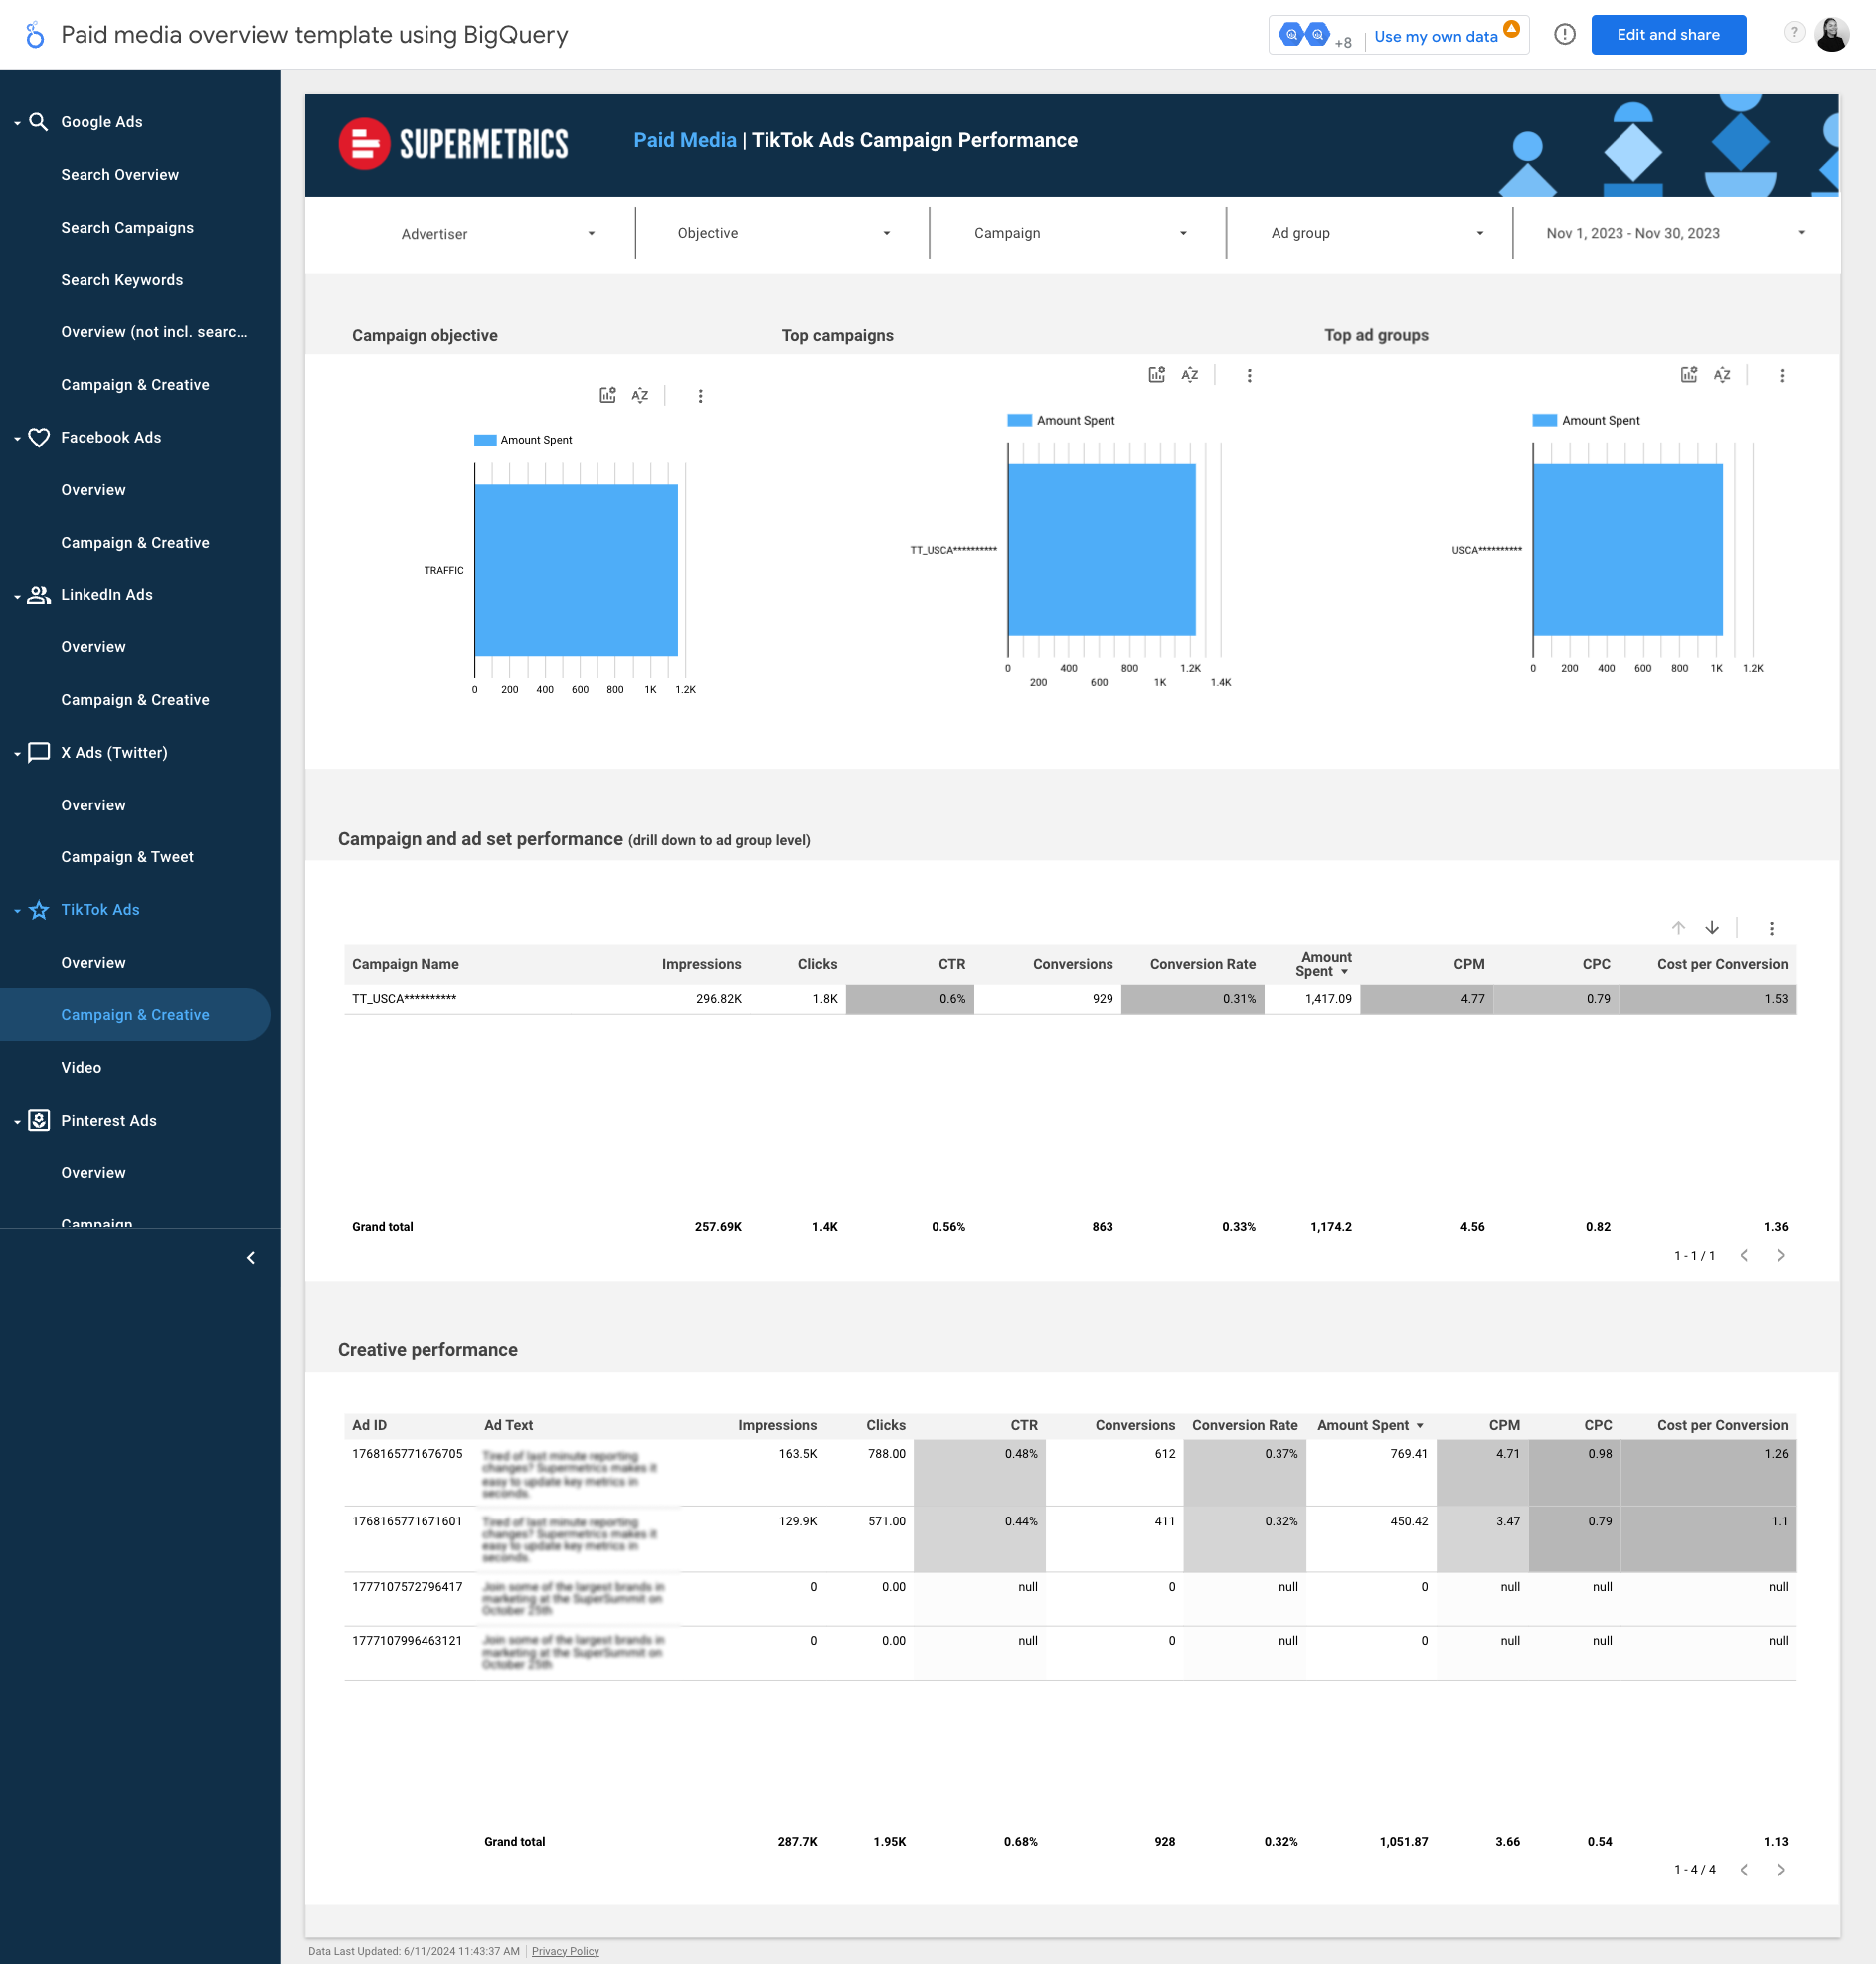
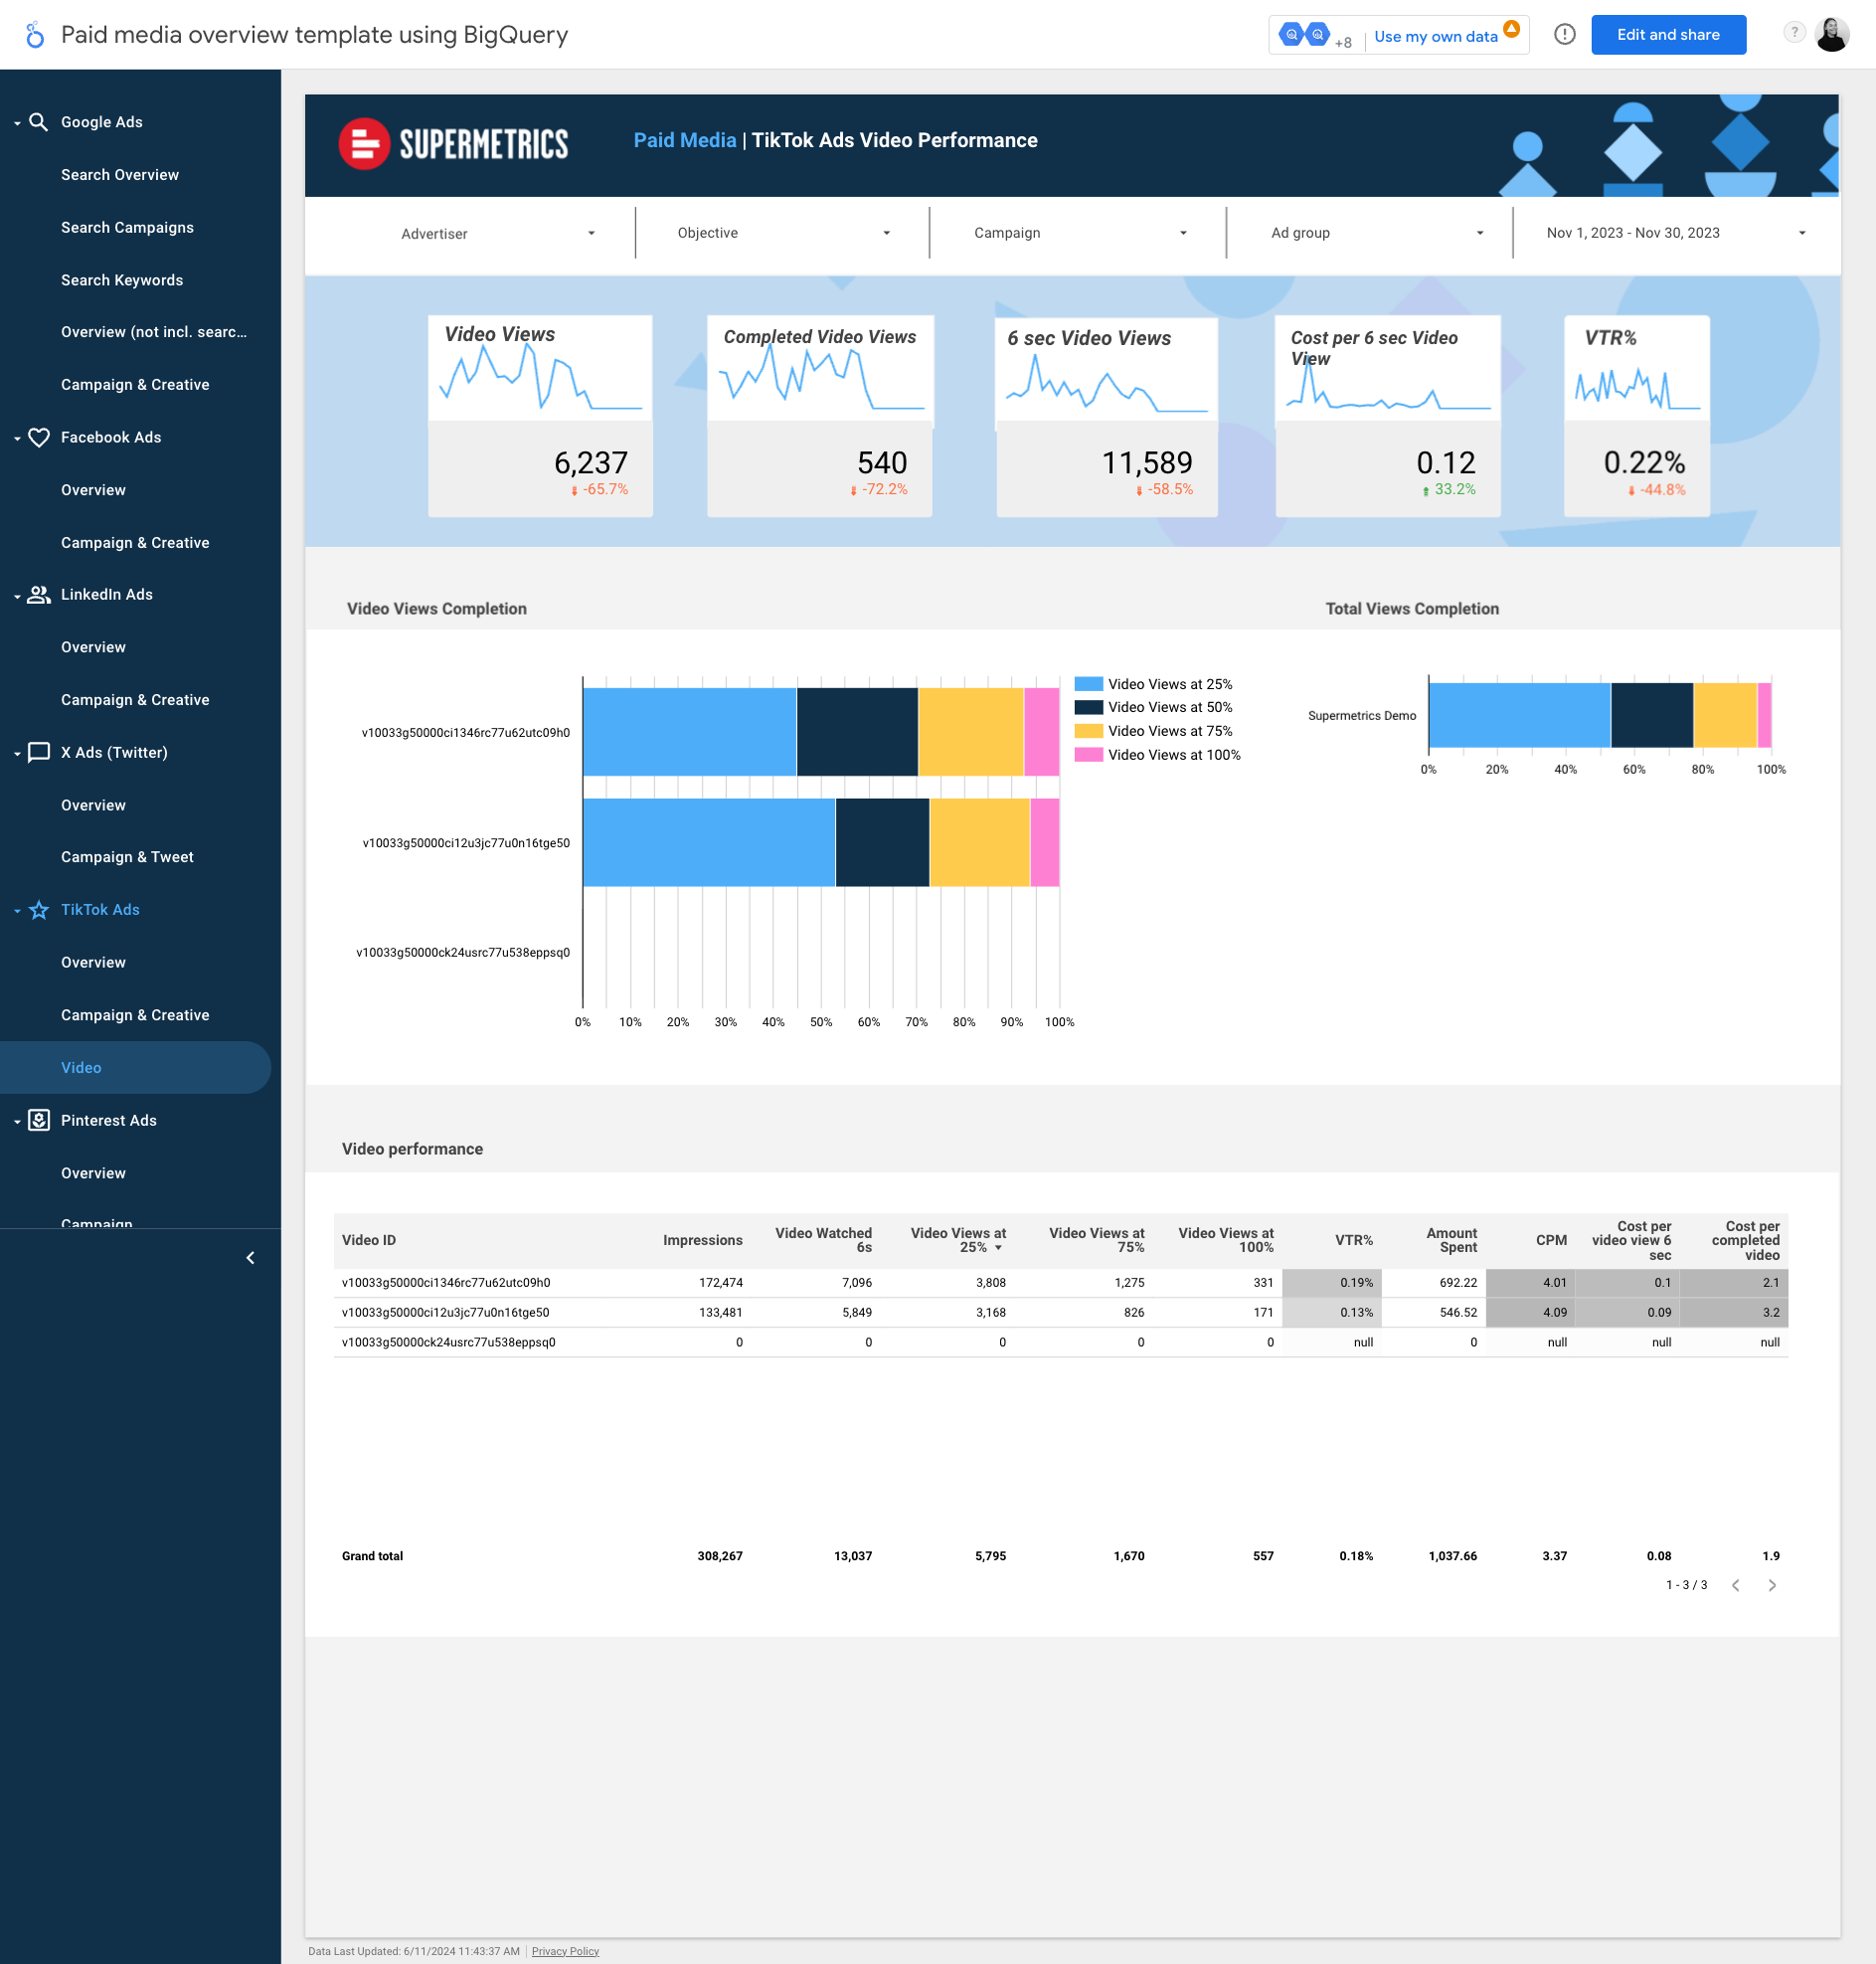
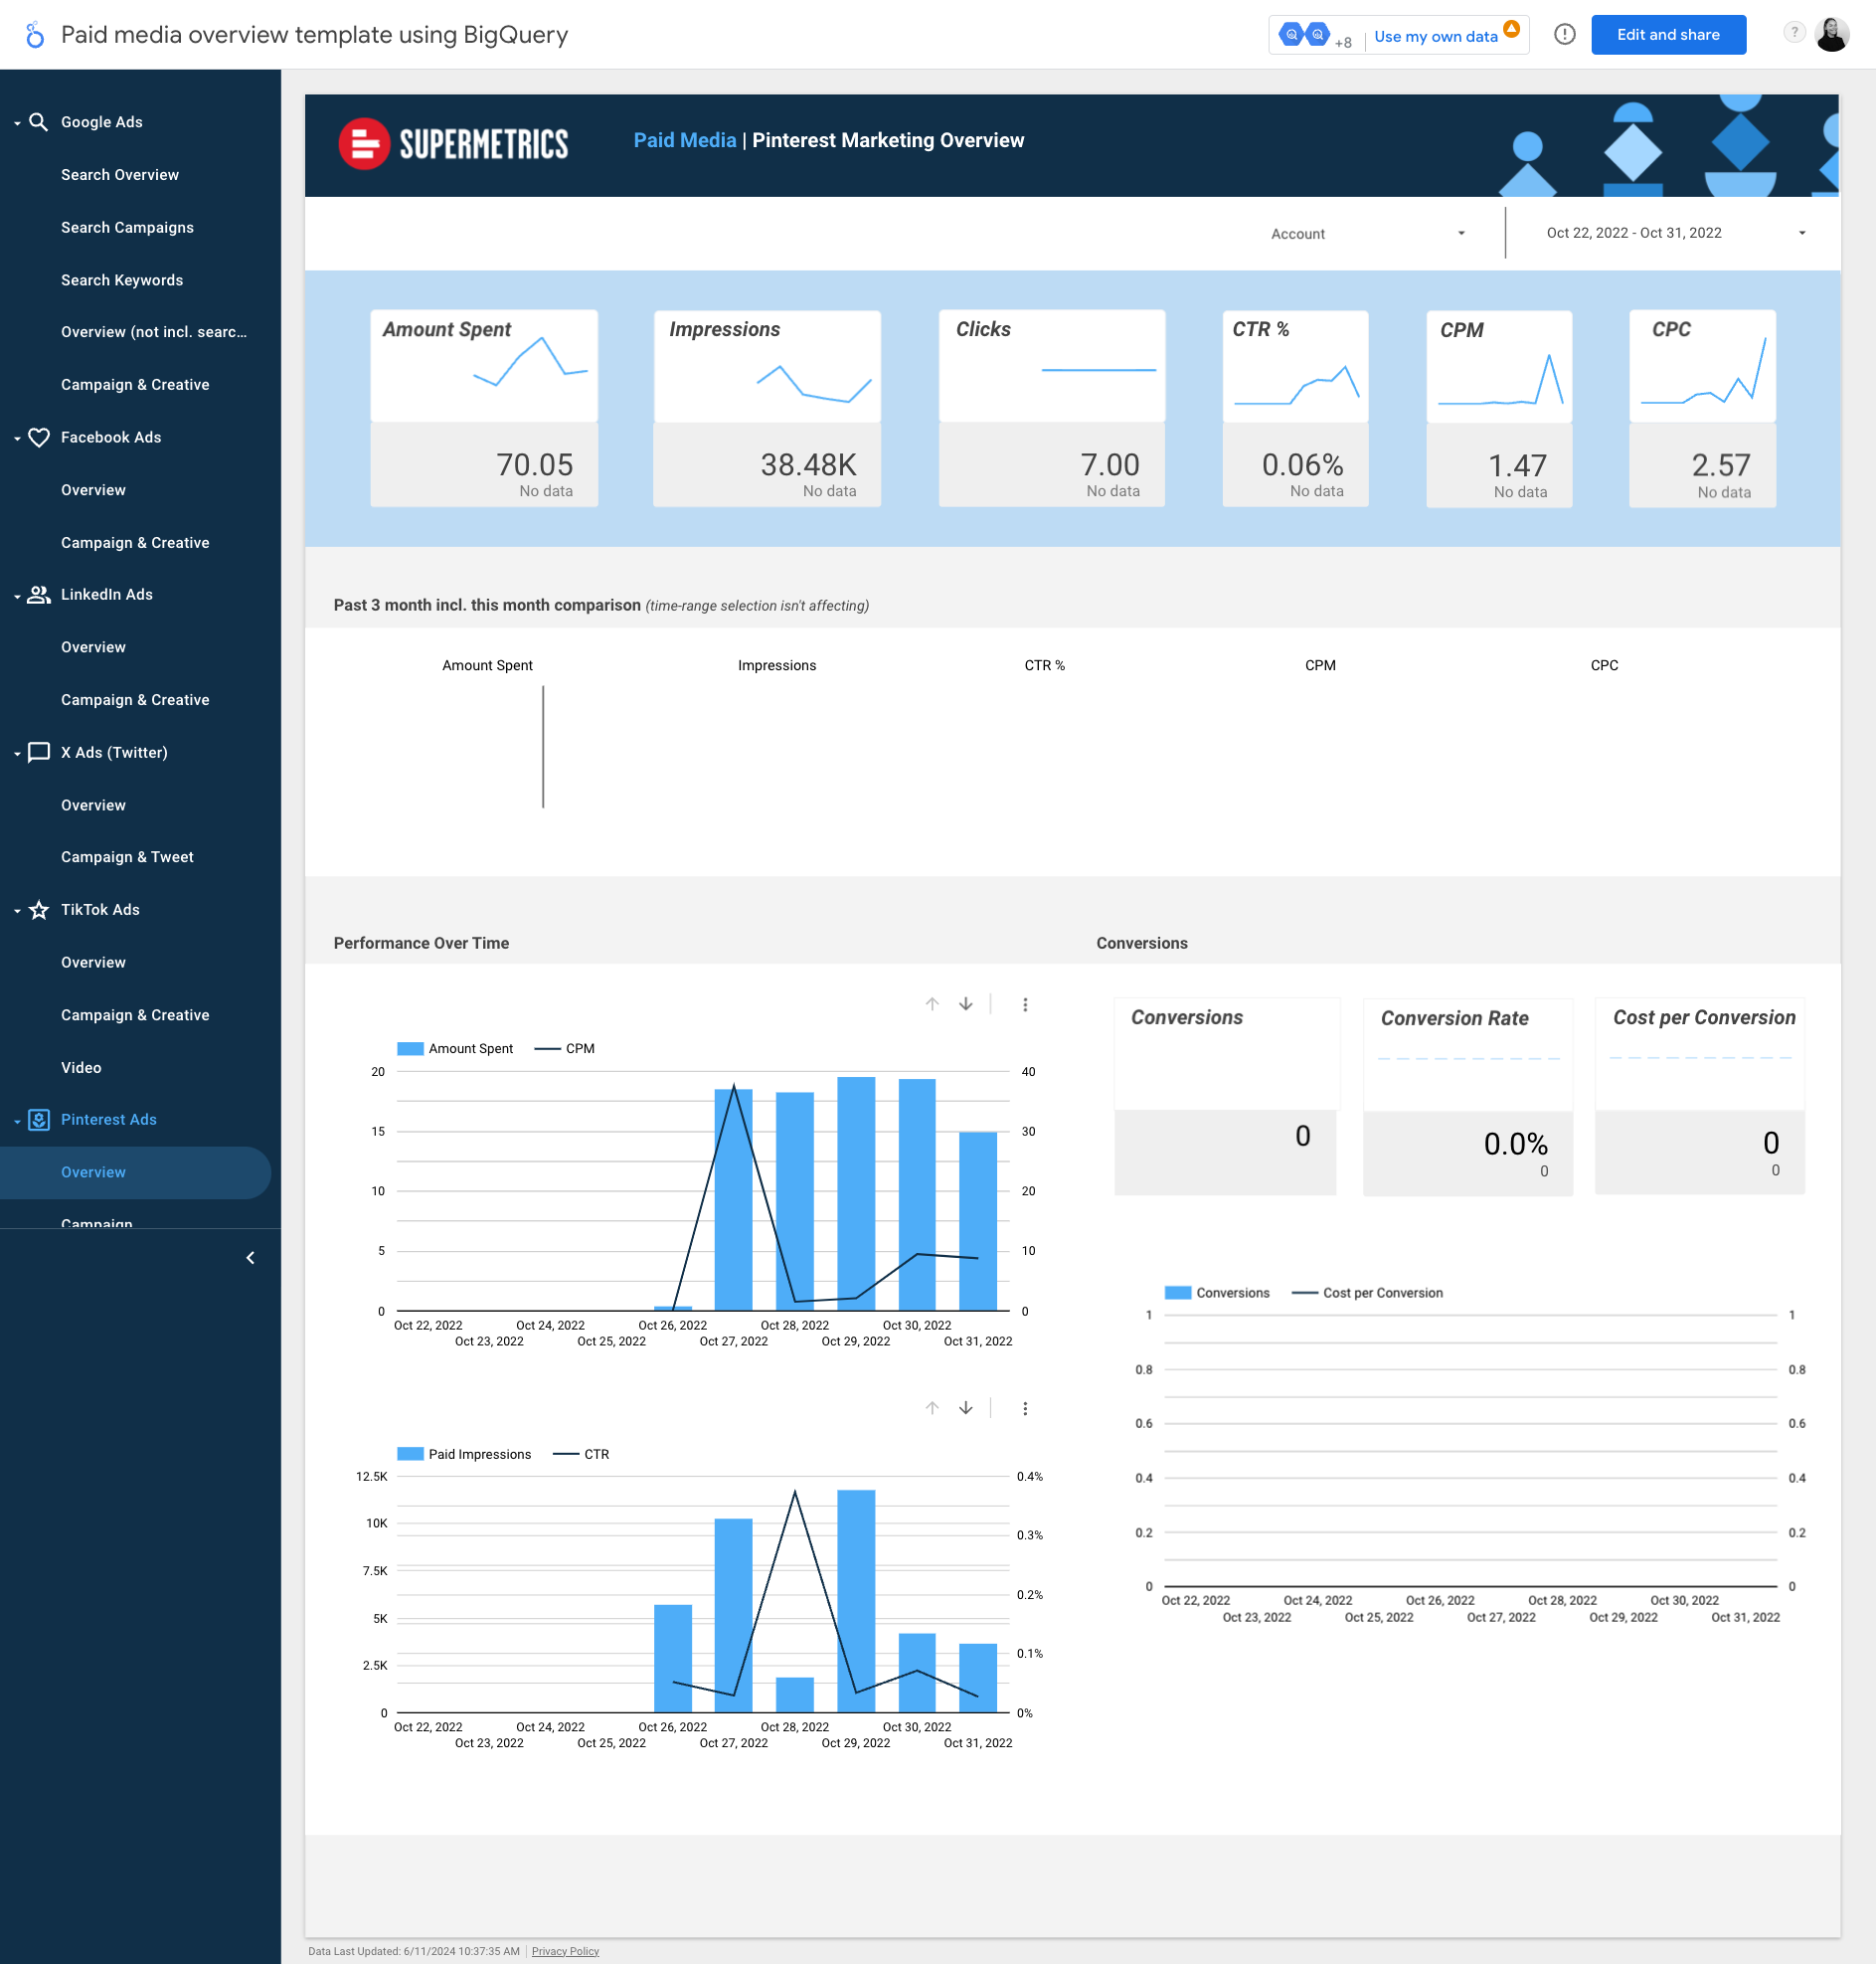
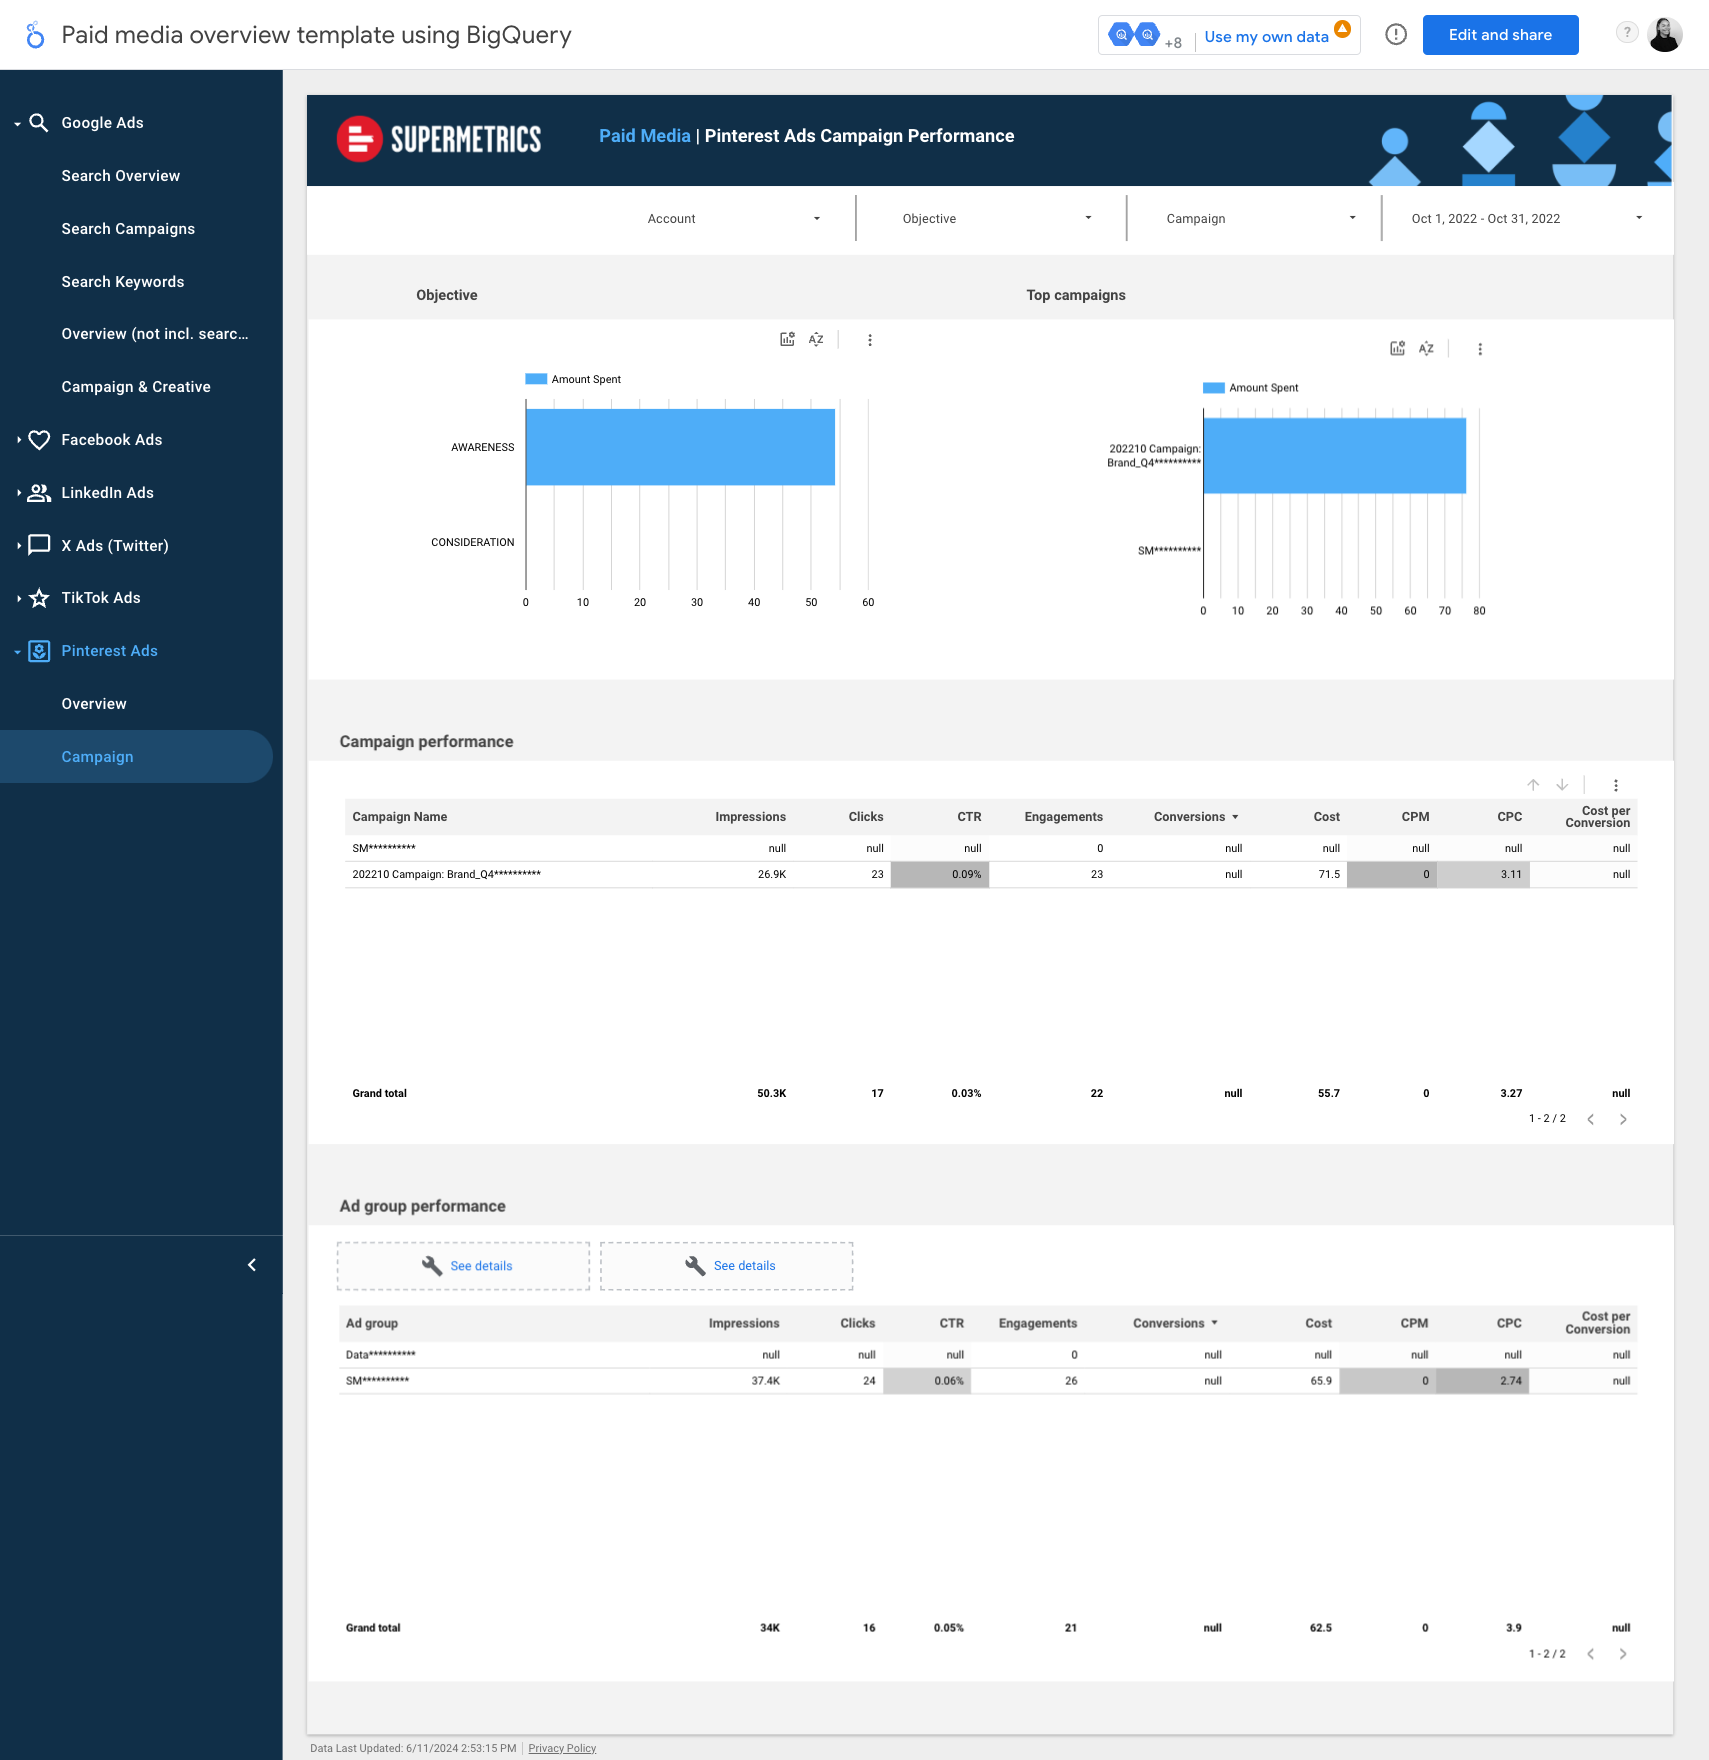
Track your paid advertising campaigns with our comprehensive template. Connect it to your data storage—either BigQuery or Supermetrics Storage—to pull in data from your paid media sources, providing a central access point to analyze key metrics like cost, clicks, and conversions in Looker Studio. Each advertising channel has its own detailed report page, allowing for in-depth analysis.
Get paid media data from BigQuery into Looker Studio
This template works with both BigQuery data warehouses and Supermetrics Storage. To get started, verify that you have access to Google Ads, Facebook Ads, LinkedIn Ads, X Ads, TikTok Ads, Pinterest Ads, and your chosen destination (BigQuery or Supermetrics Storage). Additionally, ensure you're logged in to Looker Studio and Supermetrics Hub.
Prep work:
Set-up a BigQuery destination by following these instructions. Supermetrics Storage users can proceed directly to step 2.
Follow these instructions to create transfers for each data source. In Step 4, select the STANDARD table group for this template to work.
Follow these instructions to backfill the historical data of each transfer. To start, you can backfill 3 months, proceed with the steps below, and then backfill the rest.
Once there is some data for each data source transferred to BigQuery, proceed with the next steps.
Looker Studio:
Click ‘Get the template'.
Click the ‘Use my own data' button at the top.
Hover over the data source to find the table name, you'll need this later.
Click 'Replace data'.
Authorize Looker Studio to connect to your BigQuery projects.
Choose the project and dataset where you transferred the data during the initial prep work.
Choose the corresponding table name from step 3, then click 'Next'.
Repeat steps 2 to 7 with each table/data source. You can skip data sources that you don't use and remove those pages later.
Click 'Edit and Share' - this will make a copy of the template so you can start toanalyze your data.
If the edit button doesn't appear or errors show on the new copy, reload the page or find the template copy on the Looker Studio homepage.
“Supermetrics helped us close a new 7-figure client thanks to our data warehouse offering. Along with thousands of hours in time savings, combining Supermetrics for Google Sheets and BigQuery has transformed our analytical capabilities.”
Tim Haag
Analytics Director at Mindgruve
“Collecting data from fragmented data sources is something we struggle with everyday and this is something Supermetrics helps us with this.”
Jesse Korhonen
Insights Analyst at TBWA
“Before Supermetrics we could only work on 50% fewer projects. Now we’ve been able to double our client base and it’s given us the possibility to scale our business faster and in a more structured way. Without Supermetrics, it would have been very difficult for us to be this successful.”


 Tim HaagAnalytics Director at Mindgruve
 Jesse KorhonenInsights Analyst at TBWA
 Vicken SayrinFounder and Director at VS Com agency


