Mar 15, 2024
What’s new at Supermetrics in March 2024
3-MINUTE READ | By Joy Huynh & Tea Korpi & Ha Tran
[ Updated Mar 21, 2024 ]
Happy to see you again. It’s been a month since we brought you the latest news and product updates from Supermetrics. In this edition, we’ll walk you through:
- The new Home tab in the Supermetrics sidebar for Google Sheets
- New early-access connectors
- Marketing Intelligence Cloud updates
- Watch on-demand: Budget pacing masterclass
- New reporting templates for Looker Studio and Google Sheets
- Events
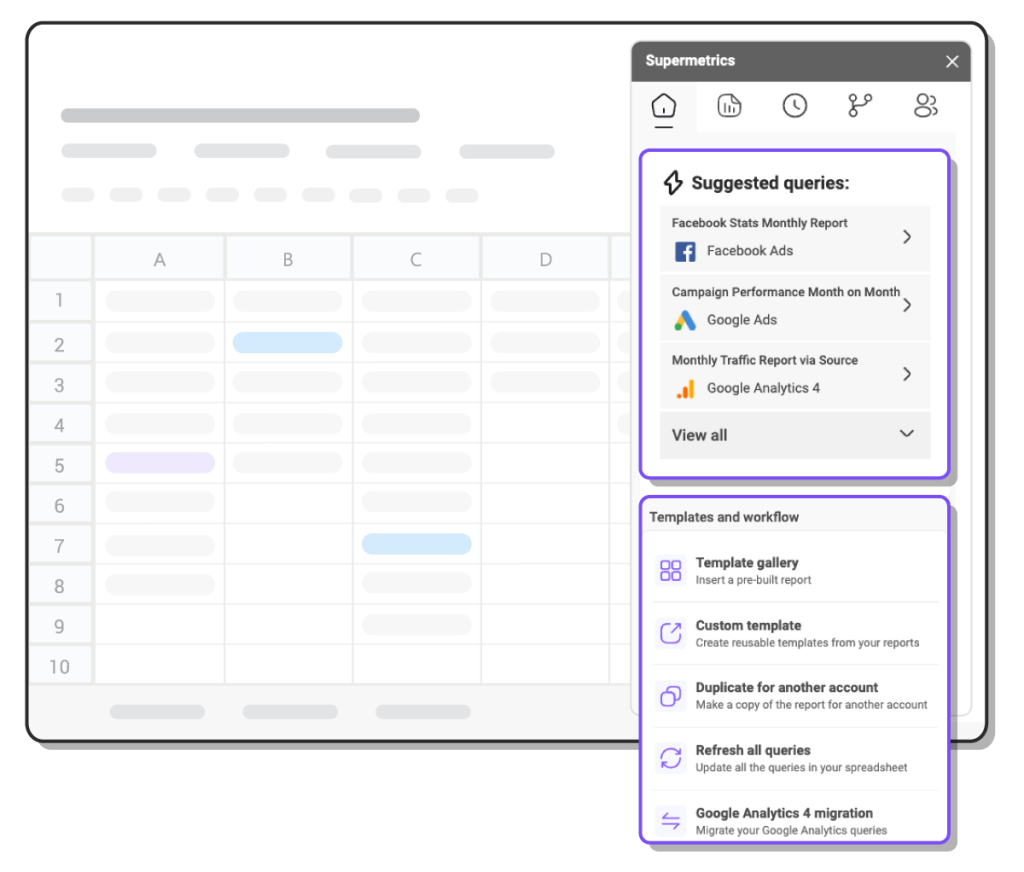
Introducing the new Home tab in the Supermetrics sidebar for Google Sheets
The Home tab keeps everything you need within reach. You’ll see:
- Suggested queries: The most popular queries among our marketers
- Template and workflow: Try our free pre-made templates and jump-start your reporting in Google Sheets
Learn more about this update on our support site.
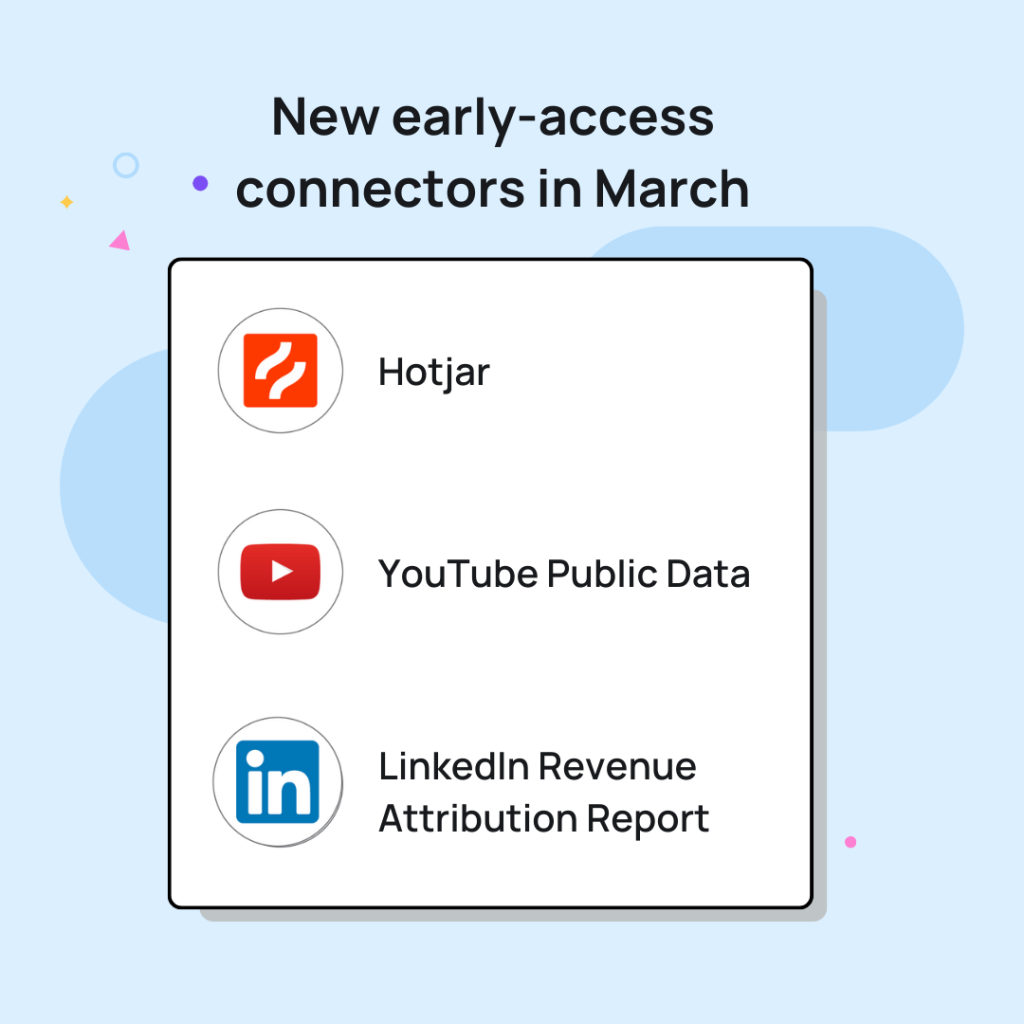
New early-access connectors
This month, we’re bringing you three new connectors, including:
- LinkedIn Revenue Attribution Report: Share insights from your LinkedIn Revenue attribution report across your organization and see the true impact of your campaigns
- Hotjar: This connector lets you pull survey response data from Hotjar and analyze answers alongside your other web analytics data. Pull fields such as survey questions, responses, and user details
- YouTube Public Data: Improve benchmarking by pulling your competitors’ channel data and video statistics and comparing those to yours. Gain insights into subscriber numbers, video likes, views, etc.
To access these connectors, log in to your Supermetrics Hub, click ‘Connect’, choose ‘Data sources’, and search for the connector you want to try.
Want to pull data from a brand-new platform? Head over to the Supermetrics product roadmap and leave us a request.
Marketing Intelligence Cloud feature updates
Supermetrics Marketing Intelligence Cloud is a centralized platform that allows you to consolidate, transform, and move data to any reporting and analytics destination. We’ve updated the data blending and custom fields feature to improve your data transformation experience.
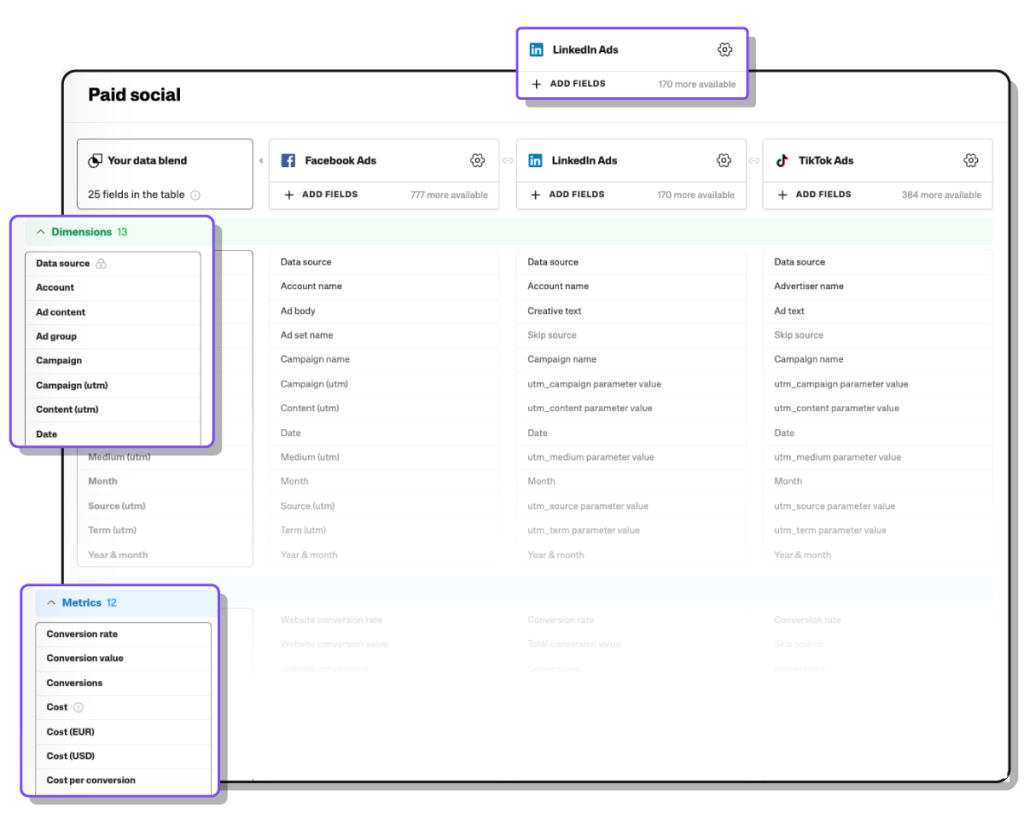
Improvements to the data blending interface
We’ve updated the data blending field mapping view to add clarity when blending sources together. You’ll see:
- Metrics and dimensions separated: This makes distinguishing between the type of data you’re working with easier. Additionally, you’ll see dimensions in green and metrics in blue
- Field count visibility: You’ll see how many fields are available from each data source
- Field grouping: When you click ‘Add fields’, you’ll see fields grouped by categories. This makes it easier to find specific types of data you need. For example, time, account, campaign, budget, etc.
- Improved tooltips: When you hover over a field, you’ll see tooltips explaining the purpose of different fields—what data they represent—and how they can be blended together
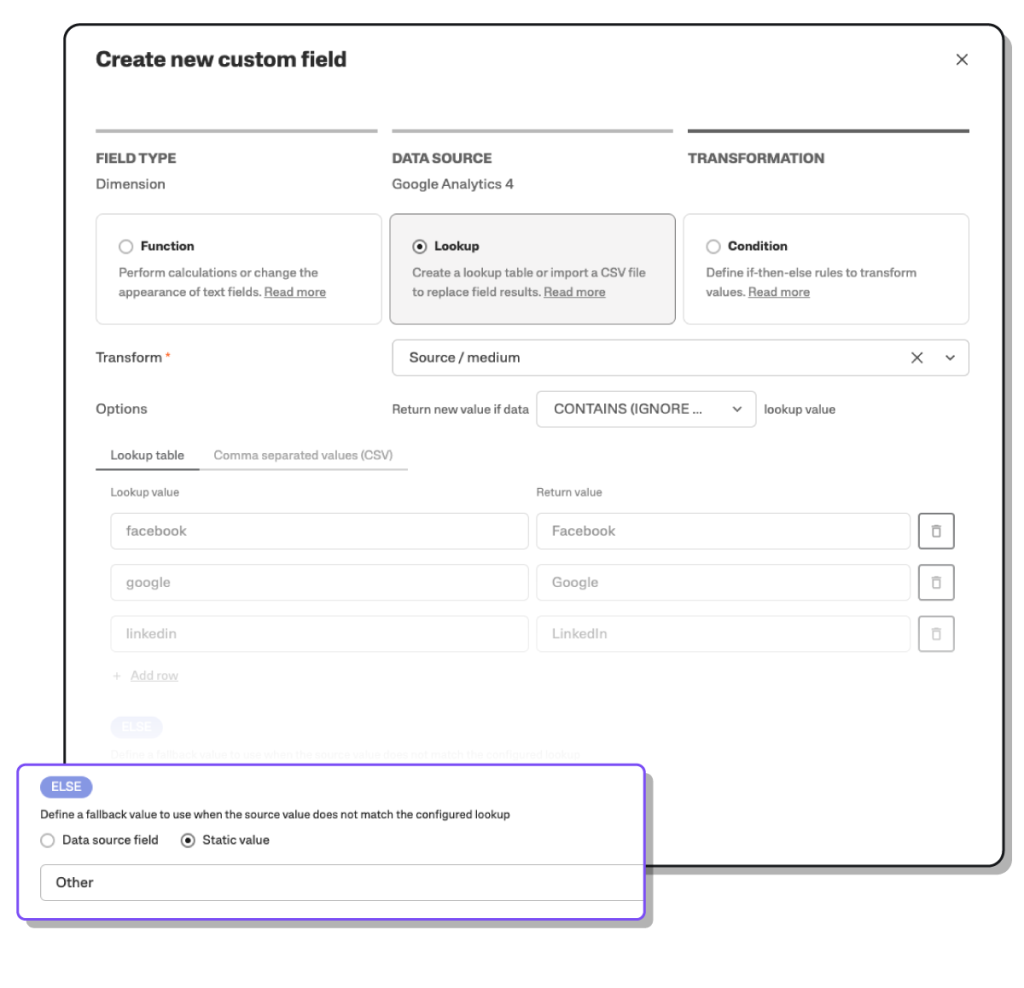
Improvements to the custom fields interface
Previously, it returned the original value if you didn’t set a lookup value for a specific field. Now, with the ‘ELSE’ condition, you can define what the custom field shows when the lookup doesn’t have a matching set value. Here are the fallbacks you can use:
- Return the original value: this keeps the value that was used for the lookup, even if there’s no match in the table
- Return a value from another data source field: you can choose a different field from the same data source or another data source to be displayed if the lookup fails
- Group all unmatched values: this allows you to set a static value, for example, ‘Not found’ or a blank value, to be shown in case the lookup fails
See the changes in action in your Supermetrics Hub.
Watch on-demand: Budget pacing masterclass
Our budget pacing masterclass is finally available on-demand. Get your pen and paper ready as our experts, Milja Nevalainen and Courtney Waganer, walk you through:
- The foundation of budget pacing
- Best practices for building your budget pacing sheet
- Templates for budget pacing
- The most frequently asked questions about budget pacing
If budget pacing interests you, don’t forget to also check out our article Automate ad spend tracking and budget pacing with Google Sheets and Supermetrics [Free cheat sheet and template included]
New reporting templates for Looker Studio and Google Sheets
Google Ads overview report for Looker Studio
This template helps you identify the best Google Ads campaigns and make better data-driven decisions about and how to improve them. For example, you’ll see:
- The total number of clicks, impressions, conversions, and cost for different campaigns over time
- The average cost of each conversion
- Revenue generated for every dollar spent on ads
- Performance comparison by device and country
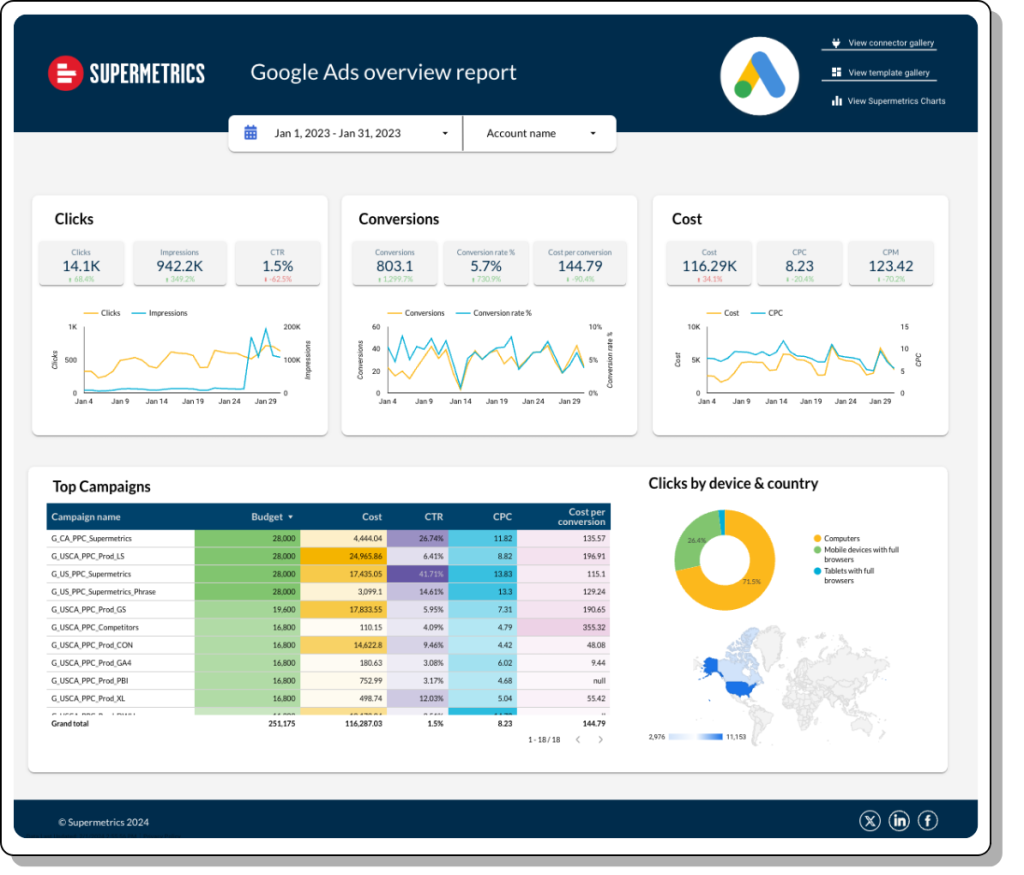
Check out the free Google Ads overview template >>
LinkedIn Ads dashboard template for Looker Studio
You can use this template to gain valuable insights into your LinkedIn Ads campaign performance, including:
- The total number of clicks and impressions
- Top performance campaigns in terms of clicks, conversions, and revenue
- Sudden surge or decline in your performance over time
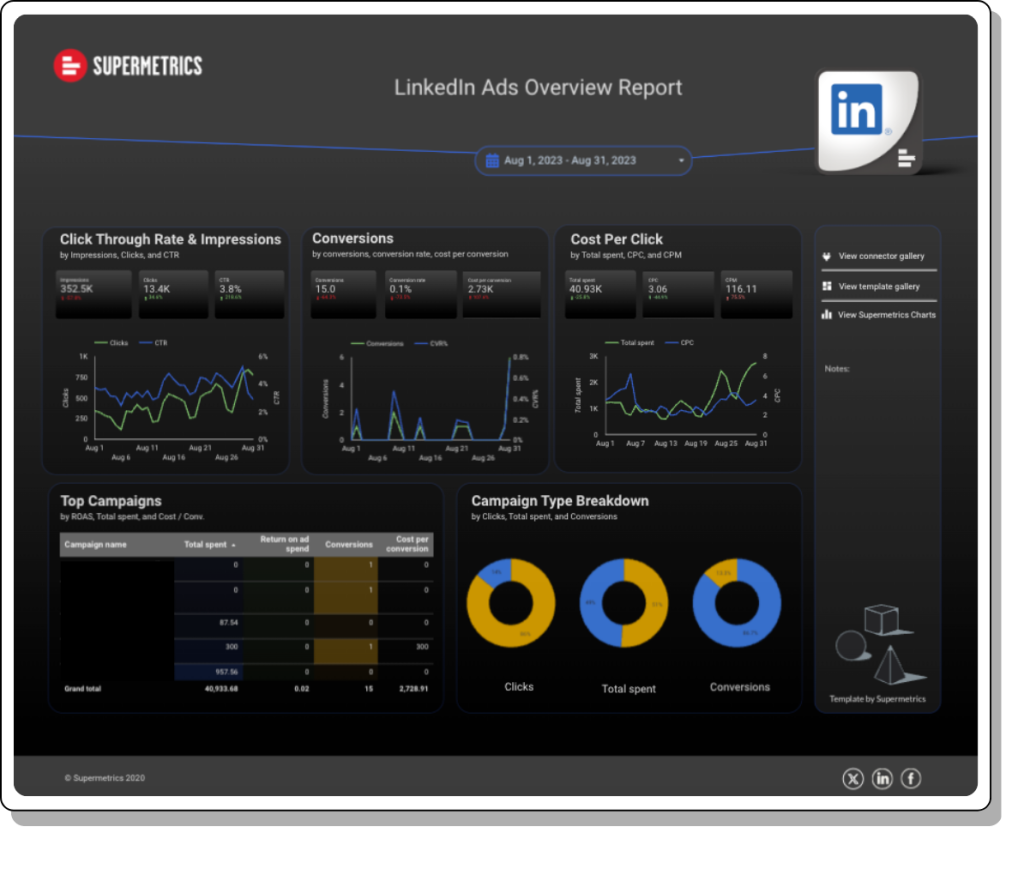
Check out the LinkedIn Ads overview report >>
Channel-level budget pacing template for Google Sheets
With this channel-level budget pacing report, you can compare spending across all your paid media channels. You’ll be able to answer the following questions:
- How did last month’s spend compare to this month’s spend?
- How was I pacing against the channel-level budget last month?
- How am I pacing against the channel-level budget this month?
- How am I pacing across all paid media channels?
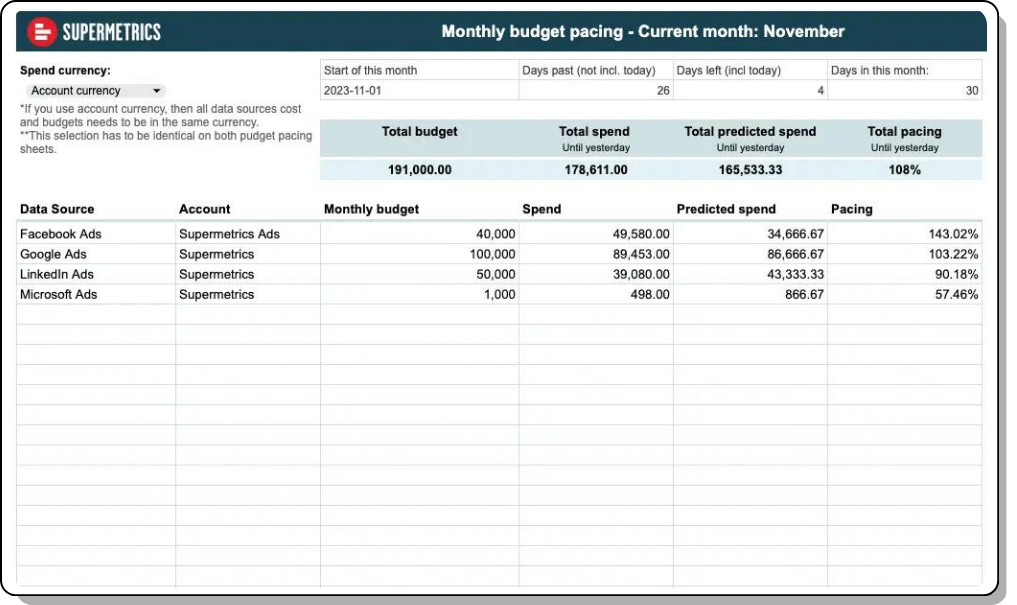
Get the channel-level budget pacing report template >>
Events
ALL4CUSTOMER expo 26-28 March at Paris porte de Versailles Pavillon 4
Bonjour à tous!
Supermetrics is gearing up for All4customer from 26th to 28th March 2024 in Paris. Join us at booth number B42!
This exhibition is a must-attend for anyone keen on exploring the latest trends in customer experience, digital marketing, ecommerce, data, and artificial intelligence. Don’t miss the chance to connect with us at All4customer!
Semji’s annual SEO Square
SEO Square is the SEO and Content Marketing conference that brings together +2,000 Search Marketing professionals. Our Lead Global Solution Engineer, Evan Kaeding, will be speaking at Semji’s annual SEO Square on April 9 at 2:00 p.m. EST, leading the topic on Marketing Data, Fast and Slow.
Modern organizations need a combination of strategic insights and tactical execution to move their marketing agendas forward. Evan will discuss how data-powered decisions at all levels of the organization allow you to act fast, improve long-term decision-making, and increase ROI for every piece of content created.
And that’s a wrap for March. If you have any product requests, leave us a request on the Supermetrics Product roadmap.
See you next month!
About the author

Joy Huynh
Joy is the Content Strategist at Supermetrics. She's working with writers and subject matter experts to create marketing data content that's helpful and fun to read.
Tea Korpi
Tea is a Senior Product Marketing Manager at Supermetrics. She helps customers understand how to use Supermetrics products and ensures they get relevant information at the right time.
Ha Tran
Ha is a Product Marketing Manager at Supermetrics. She helps customers make the most out of Supermetrics products to improve their work quality and efficiency.
Turn your marketing data into opportunity
We streamline your marketing data so you can focus on the insights.