
Marketing report & dashboard templates
Save time on reporting with Supermetrics' marketing dashboard templates for Looker Studio, Power BI, Google Sheets, and Excel,
and turn your marketing data into insights that drive better decisions.


Looker Studio
Google Trends report template for Looker Studio


Looker Studio
AdRoll reporting template for Looker Studio

Looker Studio
AdSense monthly reporting template for Looker Studio

Looker Studio
Adobe Analytics performance template for Looker Studio
Looker Studio
Apple Search Ads overview report for Looker Studio


Looker Studio
CallRail call tracking dashboard for Looker Studio


Looker Studio
Criteo reporting dashboard template for Looker Studio

Looker Studio
Ecommerce dashboard template for Looker Studio

Looker Studio
Facebook Ads ad fatigue template for Looker Studio


Looker Studio
Facebook Insights reporting template for Looker Studio


Looker Studio
Google Ad Manager reporting template for Looker Studio


Looker Studio
Google Ads reporting template for Looker Studio


Looker Studio
Google Analytics 4 reporting template for Looker Studio


Looker Studio
Google Campaign Manager 360 reporting template

Looker Studio
Google My Business local SEO template for Looker Studio

Looker Studio
Google Play Reviews report template for Looker Studio


Looker Studio
HubSpot cross-portal overview template for Looker Studio


Looker Studio
Instagram Insights reporting template for Looker Studio

Looker Studio
Instagram Public Data template for Looker Studio

Looker Studio
Klaviyo email report template for Looker Studio
Looker Studio
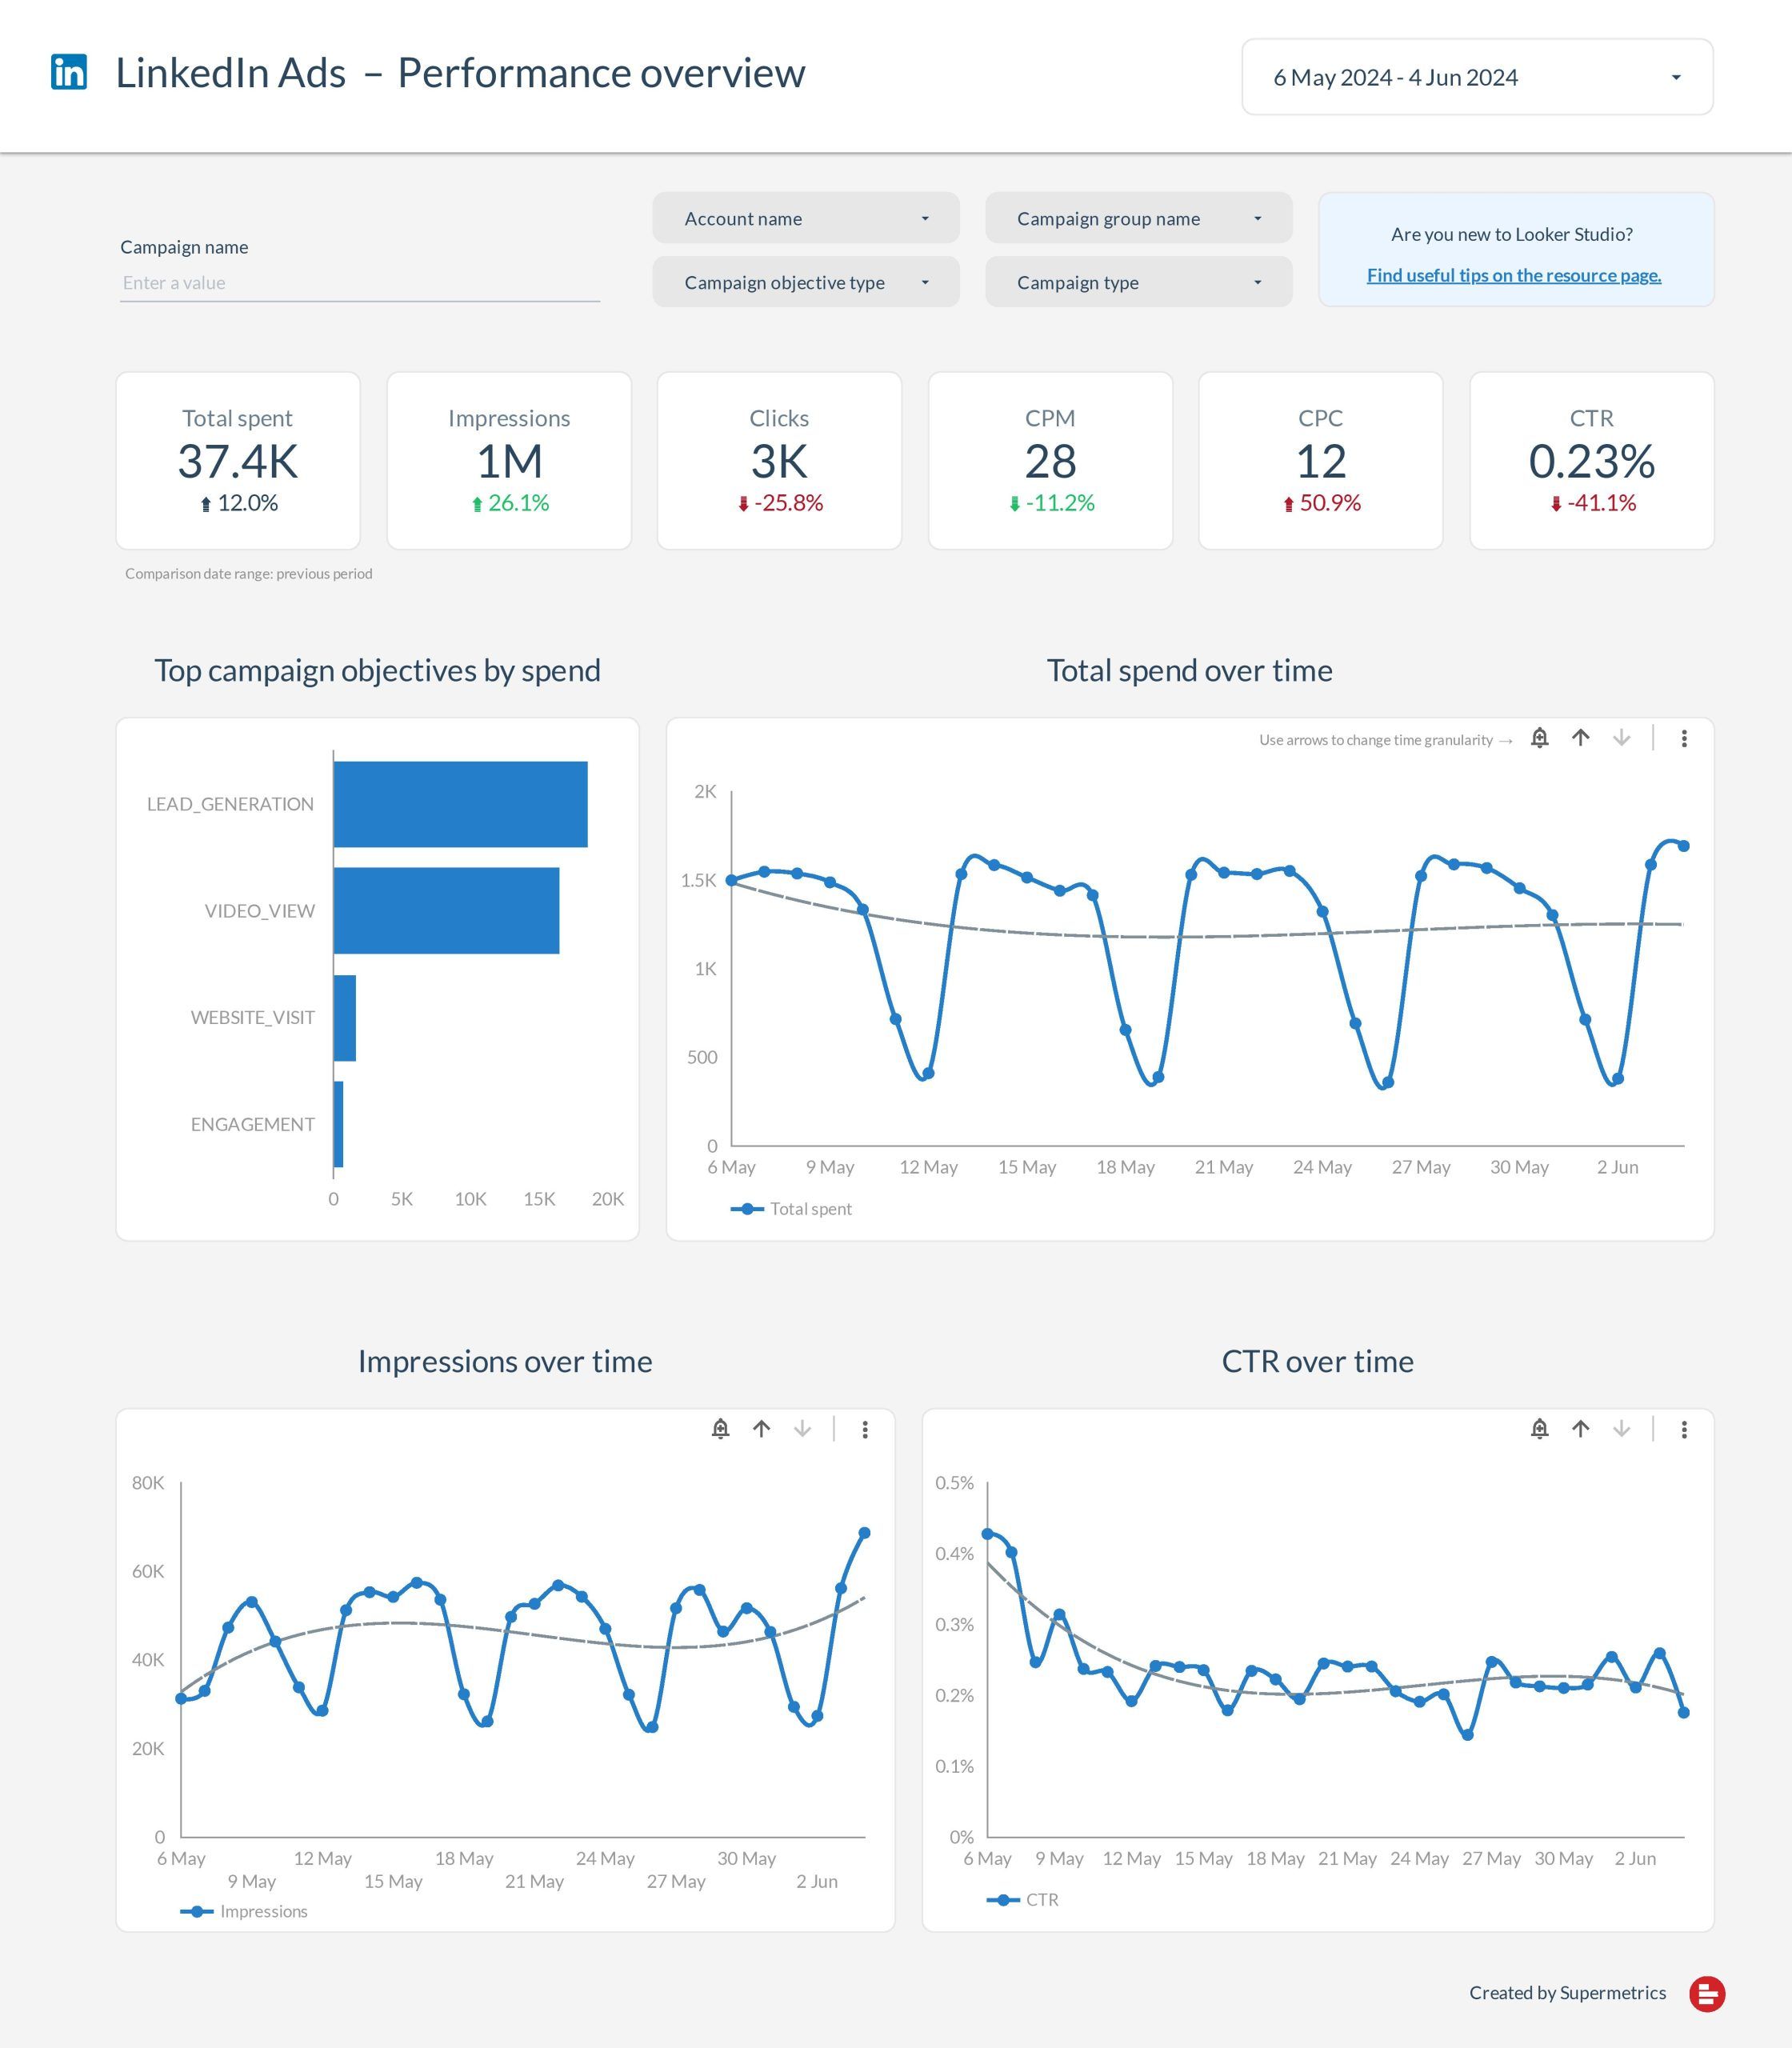
LinkedIn Ads reporting template for Looker Studio


Looker Studio
LinkedIn Company Pages template for Looker Studio


Looker Studio
Moz SEO reporting template for Looker Studio


Looker Studio
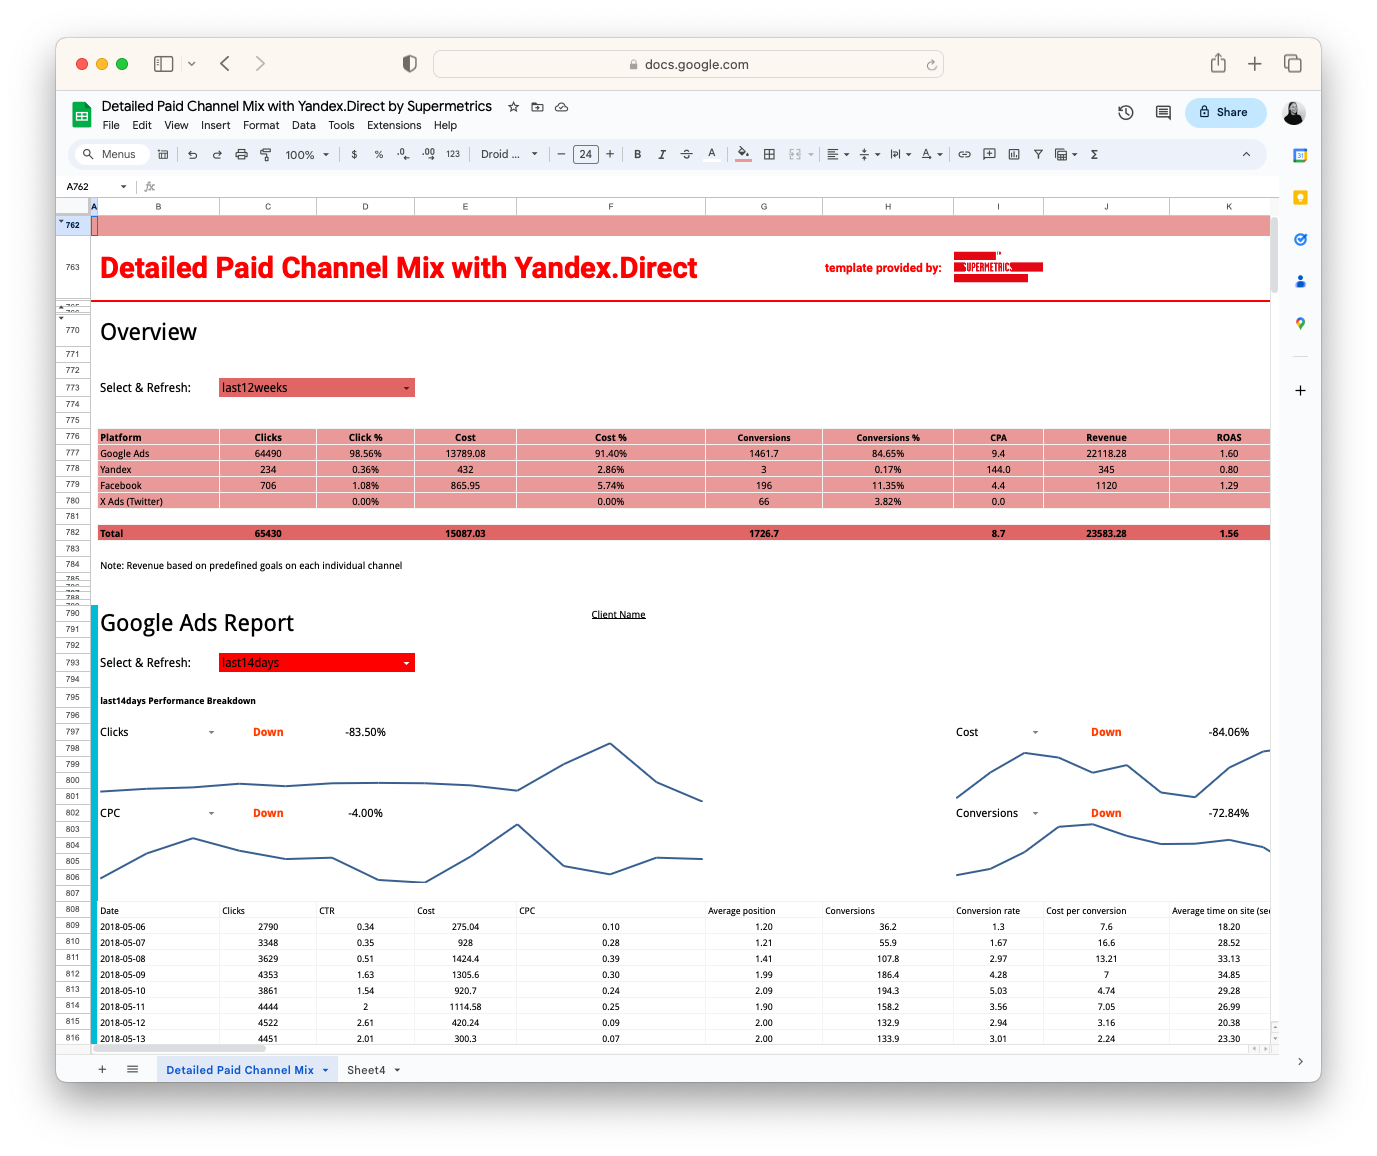
Paid Channel Mix template for Looker Studio


Looker Studio
Pinterest Ads reporting template for Looker Studio

Looker Studio
Pinterest Organic reporting template for Looker Studio

Looker Studio
Semrush SEO report template for Looker Studio

Looker Studio
Semrush competitor analysis dashboard for Looker Studio

Looker Studio
Semrush competitor analysis dashboard for Looker Studio
Looker Studio
Shopify reporting template for Looker Studio


Looker Studio
TikTok organic reporting template for Looker Studio


Looker Studio
X (Twitter) tweet engagement report for Looker Studio
Looker Studio
X Ads (Twitter) dashboard template for Looker Studio

Looker Studio
YouTube analytics reporting template for Looker Studio


Trusted by 200,000+ companies in 120 countries


