Apr 17, 2024
Google Analytics 4 guide for marketers: How to set up your properties and make the most of your GA4 data
13-MINUTE READ | By Minna Tuikka & Rosanna Campbell
[ Updated Apr 17, 2024 ]
Here at Supermetrics, we’ve spent the last several months helping marketers navigate the (sometimes complex) transition from Universal Analytics to Google Analytics 4 (GA4) and also setting up our own properties.
In this article, we’ll share best practices for setting up GA4 that we’ve learned along the way.
Skip ahead:
- What’s so different about GA4?
- What can you do with GA4?
- How to set up GA4
- GA4 terminology
- How to set up custom events in GA4
- Navigate the GA interface
- Basic GA4 reports
- Export GA4 data
- Best practices for making the most of GA4
- GA4 data retention policy
What’s so different about Google Analytics 4?
GA4 represents a complete overhaul of how web analytics works in Google. Since 70% of all web analytics are done via Google’s tools, this change has had the marketing world in a bit of a flap.
There’s a lot of technical detail about how the underlying infrastructure of GA4 differs from Universal Analytics (Google’s previous web analytics solution), but in broad strokes:
- GA4 lets you combine data from your website and mobile app automatically
- GA4 only stores user data for 14 months
- The GA4 data model gives you much more information about what people actually do on your website
Read more about the differences between GA4 and UA.
What can you do with Google Analytics 4?
GA4 is there to help you understand what’s going on with your website. You can find answers to specific questions, like:
- How many web visitors you’re getting
- Where your web visitors live
- How they find your website
- How many visitors convert into leads
- How many visitors were sent by each marketing campaign you’re running
- How long people spend looking at each page of your website
- Which pages are getting the most visitors
- Which pages are driving the most conversions
To start collecting this information, you’ll need to set up a tracking code on your website.
How to set up Google Analytics 4
Create a GA4 property
To get started, you’ll need to log into your Google account and create an Analytics account (if you don’t already have one set up for Google Universal Analytics.) Make sure you have admin rights for the website (or app) you want to monitor.
Next, you’ll need to create a GA4 property. A property is just another way of saying the set of reports and data that you’re building—the website(s) and/or mobile app(s) that you want to view together.
If you’re already using Universal Analytics, then you can just click Admin (at the bottom-left side of the page) and then hit the Create new property button—any new properties will automatically be created in Google Analytics. If you’re new to Google Analytics, you’ll be guided through the process of setting up your new Property from scratch.
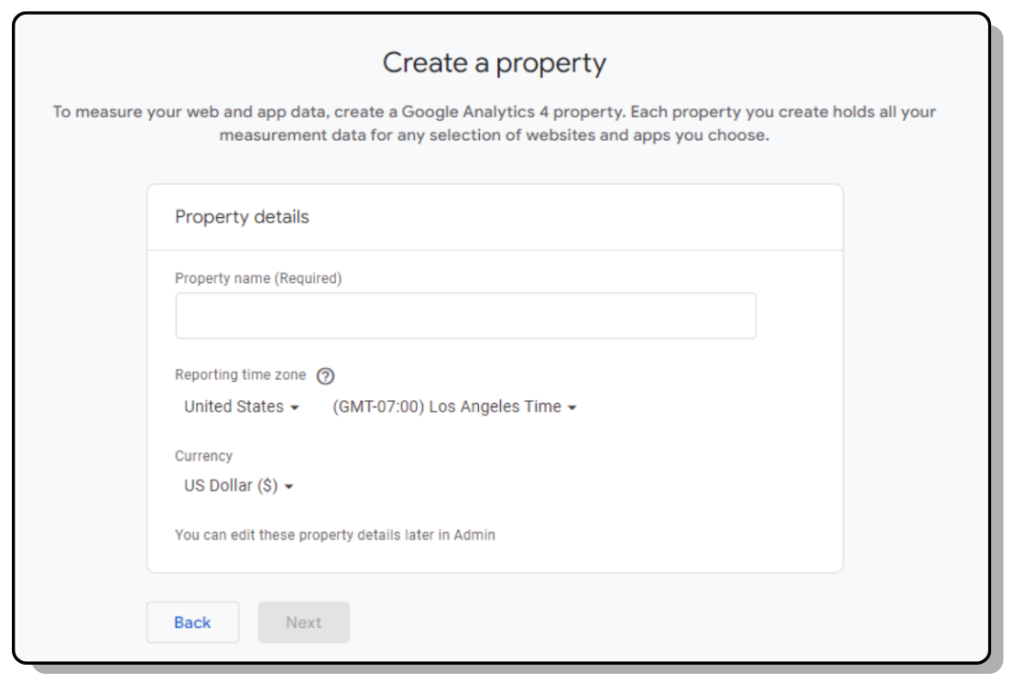
To start with, you’ll need to give your Property a name. Choose a logical name—it can only be seen internally. For example, if you’re already working with Universal Analytics, make it clear this is a GA4 property with a name like GA4_our_website.
Choose the time zone and currency that relate to your main market. Then Google asks you some questions about your business size, industry, and objectives. These are all optional and won’t actually have any impact on your use of GA4.
Once you’ve filled them in, you can hit Create. You’ll be prompted to agree to the standard Terms and Conditions at that point.
Congratulations, you’ve got your first GA4 property.
Start collecting data
As we mentioned earlier, one of the best things about GA4 is that it lets you collect data from your website and apps in the same Property, rather than having to track them separately and then pull the data together somehow. The processes for setting up the apps and website are pretty similar, so let’s look at the website procedure for now.
When you click the Web button, you’ll be prompted to add your URL and give the data stream a name. You can add enhanced measurement too. You can always turn it off later if you don’t need it.
Install your tracking code
Now you have everything set on the GA4 side, it’s time to add the tracking code to your website. You can do that in three ways:
- With the script that you can find on the “Install manually” tab
- With your website builder or CMS
- Via Google Tag Manager
The Google wizard will walk you through the first two options. If you’d like to know how to use Google Tag Manager to handle the installation, check out our video tutorial.
Once you’ve installed your tracking code, it will take a little while for GA4 to start collecting data from your website(s) and apps and bringing it into the interface.
Google Analytics Terminology
While you’re waiting for your data to populate, let’s take a look at some of the basic terms and concepts that you’ll see in GA4. Some of these are quite different from the terminology they used in Universal Analytics, so it’s worth spending a little time getting the hang of them.
Users
These are the people visiting your website. Google breaks them down into:
- Users (or active users): the number of people who engaged with your site or app in the specified date range
- New users: the number of visitors who are interacting with your site or app for the first time in the specified date range
Sessions
This is the term for each visit made by a user. A session starts whenever a user either a) opens your app in the foreground or b) views a page or screen (when no other session is currently active.)
A session ends after 30 minutes of inactivity by default. You can adjust this setting if you want to.
A session counts as an “engaged session” if a) it lasts longer than 10 seconds, b) the user views more than one webpage or screen, or c) a key event takes place (more on events in the next section.)
Events
These are the interactions with your website—anything from viewing a page to buying a product. Every time anyone does anything on your website, GA4 records it as an event. These used to be called “hits” in Universal Analytics.
There are a few different kinds of events in GA4:
- Automatically collected events: collected by default when you set up Google Analytics
- Enhanced measurement events: these are optional events that come ready-made when you set up Google Analytics
- Recommended events: these are the events that Google recommends that you add to set up your reporting capabilities (things like logins, purchases, and refunds)
- Custom events: with GA4, you can also set up your own events, but you’ll need to build a custom report to measure them. (More on custom events below.)
Key events
These are events that you decide are important to your business (say, every time you get a new lead or a lead makes a purchase). Key events have replaced what used to be called Goals in Universal Analytics.
You can choose any event to be a key event. Just choose an event that measures the action you want to see users doing on your website, and then mark the event as a key event. After you mark the event as a key event, you’ll see how many users perform the desired action.
Then, in your Reports, you can evaluate your marketing performance across all the channels in your Property.
Key events are also how you’ll track conversions in GA4. In Universal Analytics, you measured conversions by tracking transactions, while GA4 is all done with the key events feature.
Some common key events include:
- Downloading a white paper
- Starting a chat session with your Support team
- Completing a registration form
- Adding a product to the shopping cart
- Scrolling to the end of a blog post
Google has provided a longer list of ideas for key events you might want to measure on the GA4 help site.
How to set up custom events
GA4 has a pretty comprehensive range of pre-built events for you to choose from, but there are some specific situations where you might need to build your own custom event. For example, if you want to track donations or user interactions with new features, you’d probably need to create your own custom event.
Here’s how to set up custom events.
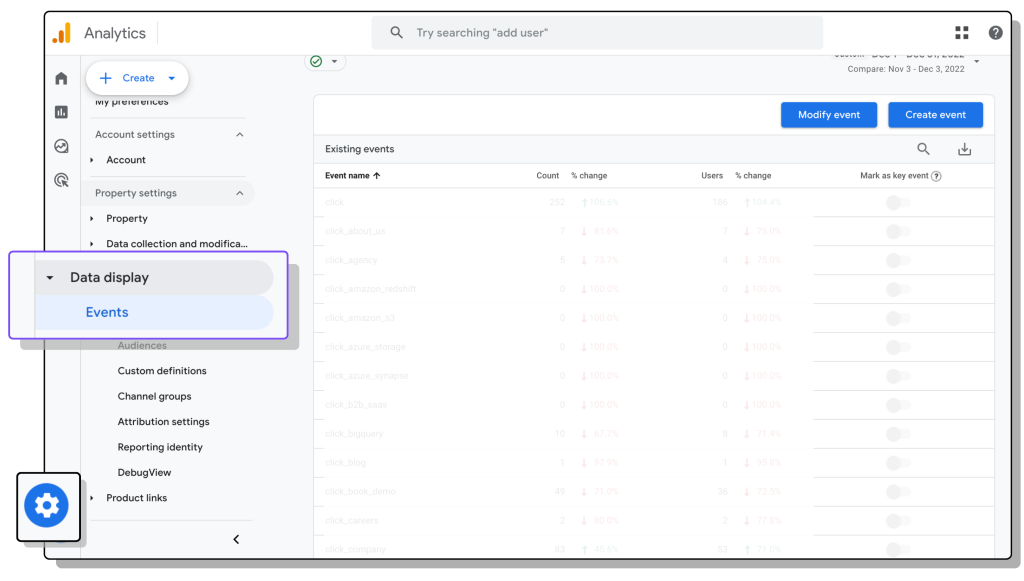
Step 1: Navigate to Data Display/Events
Use the cog at the bottom left of your screen to open your Admin panel. Then open the Data display menu and select Events.
Step 2: Click Create Event
Select Create Event. Give your event a name. Event names must start with a letter and can only include letters, numbers, and underscores. Remember that event names are case-sensitive, and you can’t reuse any existing event names.
Step 3: Set up the Event parameters
Next, you’ll set up your Event conditions so that GA4 knows when to trigger the event, for instance, by creating a new event when a parameter equals 1. You might need to set up Custom Dimensions and Metrics.
Google also provides instructions for setting up custom events using:
Navigate the GA4 Interface: What you’re looking at
Now you’ve got your Property set up, you’ll want to start looking at your data. When you open up GA4, here’s what you’ll see:
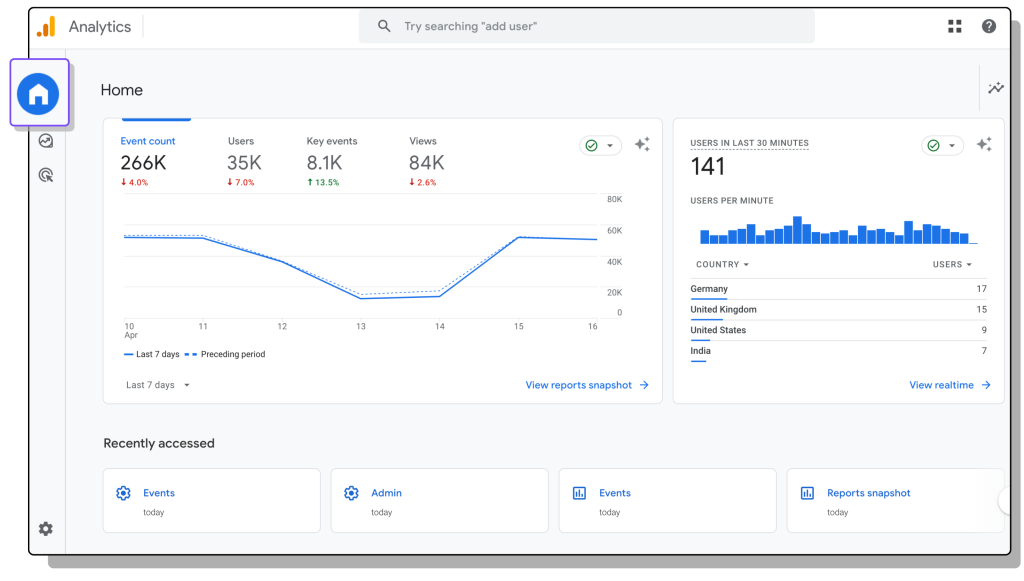
Home screen
On the Home screen, you’ll see some basic information about your website. For example, if you use the Google Demo account, here’s what you see:
The information you see on your home screen is based on your behavior. If you always look at
Key Events, for instance, you’ll see it right there on the first chart you come to.
The card on the right gives you the number of users in the last 30 minutes. You can see more real-time data if you click the View real-time button on the bottom right.
Further down on the Home screen, you’ll also see a few more charts (or “cards”, to use Google’s term):
As you can see, Google suggests cards based on your previous activity. It will also surface insights for you from your data —in general, whenever data on your website behaves in ways that Google didn’t expect it to.
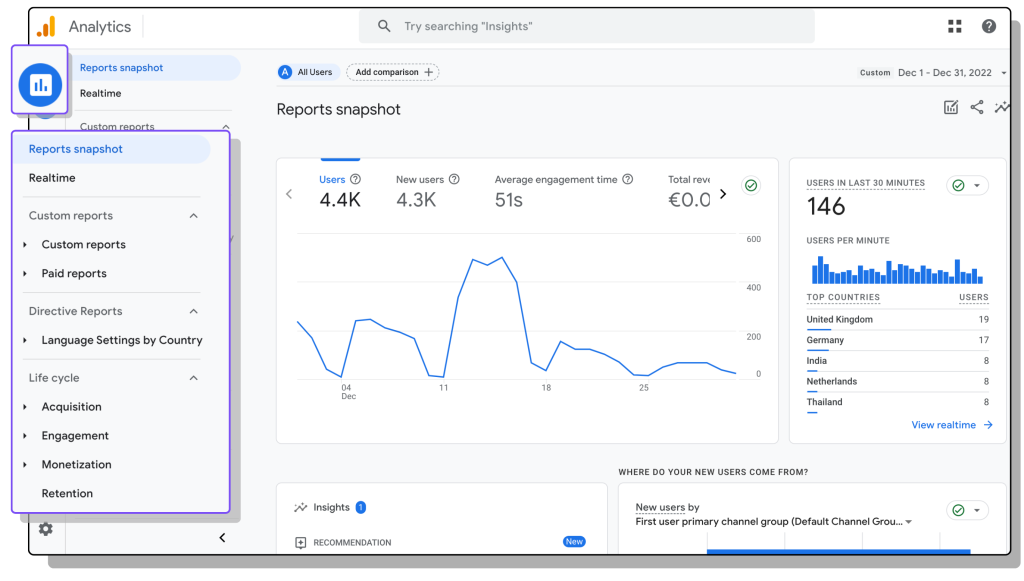
Reports
In the menu on the left-hand side of the page, you can select Reports. You can set up a dashboard called ‘Reports Snapshot’ to give you an overview of all your most important metrics. Then, if you want to get more details about your web performance, you can find several pre-built reports on your Analytics page.
A quick side note about these ready-made reports: our team has found GA4’s reporting UIthem a bit limited. In Universal Analytics, it was easier to add different metrics and dimensions to the reports and set them up how you wanted them. In GA4, you basically have two options for the dimensions—and that’s it.
💡Pro tip: If you can’t copy and paste text, like complex filter values, in GA4, we’ve got a tip for you. Instead of the usual Ctrl+C, try clicking on control and then the mouse button to copy. This little trick can be a lifesaver, particularly when dealing with complex campaign names or other specific filter values.
The reports are broken down into the following categories (all grouped under “Life Cycle”).
Basic Google Analytics 4 reports
Acquisition
Acquisition reports help you understand if your marketing efforts are attracting new users to your website or app or if your re-engagement campaigns are bringing people back. Here, you can choose between:
- Acquisition overview: summarizes all your user acquisition data. By default, you’ll see a breakdown by users and new users, users in the last 30 minutes, new users by channel, sessions by channel, sessions by Google Ad campaign, and lifetime value
- User acquisition: how new users find your website or app for the first time
- Traffic acquisition: where your traffic came from, regardless of whether the user is new or returning. By default, this is split by channel and by country
Engagement
The Engagement reports help you understand which pages and screens people are visiting and identify the features they’re interacting with. This lets you understand which of your web content is most effective and why. You can choose between pre-made reports on:
- Events: the events users trigger on your website or app so you can make improvements to the user experience and increase conversions
- Pages and screens: the pages users visited on your website (or the screens users opened on your mobile app) so you can see your best-performing content
- Landing page: the first page a visitor lands on when they visit your website and how many visitors land on each page
Monetization
Monetization reports show you your website revenue data so you can figure out which products you’re selling, how your ads are performing, or if your promotions are working.
You can look at an overview or go into more detail with the other reports:
- Ecommerce purchases: measures ecommerce activity on your website
- Purchase journey: shows you how many users drop off between each step in your purchase funnel
- Checkout journey: shows you how many users began checkout on your ecommerce website or app and completed each of the steps in your checkout funnel
- Promotions: shows the impact of each promotion on revenue
Retention
The Retention report tells you how compelling your website is. The Retention overview shows you how much time (on average) your users spend on your site or app and how many come back again.
How to export Google Analytics 4 data
If you’re frustrated with the GA4 native reports, you can export your data with Supermetrics into any platform you want. This allows you to:
- Have more flexibility with building reports
- Take full control of your data
- Store your data for a longer period of time
- Get real-time and up-to-date data
For instance, our team tends to pull our GA4 data into Google Sheets so we can see exactly the information we need the way we want to see it. We’ve put together some guides to show you how to bring GA4 data to your go-to reporting tools or data warehouse, including:
- Import GA4 or Universal Analytics data into Google Sheets
- How to import GA4 data into Looker Studio
- 2 ways to bring GA4 data into Power BI
- How to export Universal Analytics data (or GA4) to BigQuery
In case you’ve already built your web analytics report—using Universal Analytics data— in either Google Sheets or Looker Studio and you’re looking to update your reports with Google Analytics 4 data, check out this guide—How to update your Universal Analytics reports in Google Sheets and Looker Studio with Google Analytics 4 data.
Best practices for getting the most out of your Google Analytics 4 data
Once you’ve got a handle on the basics of Google Analytics, you might want to start playing around with some more sophisticated analytics. Here are a few pointers.
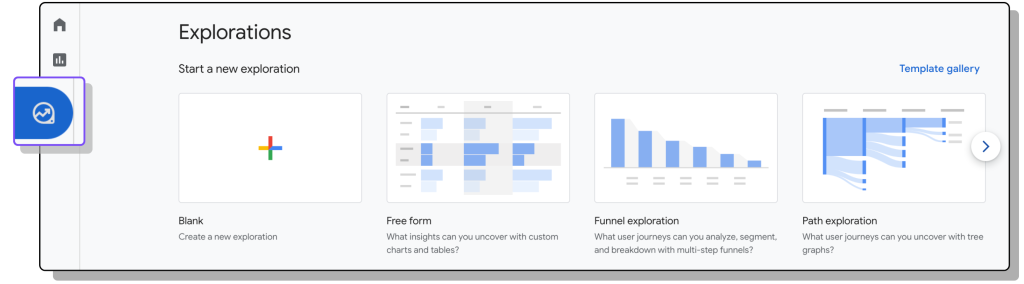
Play with the Explore function
You can set up “explorations” to dive deeper into your GA4 data. With explorations, you can drill into data to uncover detailed insights, use filtering to see only the data most relevant to you, or create segments. There are three options for how you use the Explore function:
- Free form, which lets you build your own custom charts and tables
- Funnel exploration, which lets you analyze the user journey
- Path exploration, which lets you understand the different paths through your website
The Explore function is one of the more complex areas of GA4, but it’s worth starting to play around with it as soon as you’ve got the basics under your belt.
Set up audiences and segments
In some cases, you might want to view information about just one subset of your users based on their demographics, behavior, or interests. For example, let’s say you’re running a promotion in New York and want to see if you got more web visitors from New York during the promotion.
You have two options for breaking up your data into subsets in GA4: you can create audiences or segments. The two terms have quite a bit of overlap—they both refer to subsets of your web visitors based on parameters that you set.
The main difference is that you need to create an audience if you want to use the standard reports. If you want to use the Explorations feature, you need to create a segment.
Another point to consider is that Audiences aren’t retroactive—meaning that you’ll only see separate data on the audience from the date you created it and onwards. Segments will also let you look at historical data.
To create a new audience:
- Go to the Admin page, and then under Data display, click Audiences.
- Click New Audience.
- You can then choose between:
- Creating a new audience from scratch by defining all the parameters yourself or
- Using a pre-made template or “suggested audience” and modifying the existing parameters
To create a new segment:
- Go to the Explore page.
- Select an existing exploration (or create a new one).
- On the left, click the plus sign in Tab Settings in the Segments section. Then either:
- Create a custom segment from scratch by defining all the parameters yourself or
- Start with a suggested segment (pre-built segments based on common use cases). You can adapt them to your specific needs.
There’s a guide to creating segments on the Help site, too.
Integrate GA4 with Looker Studio
Looker Studio (Data Studio) is Google’s own data visualization tool. It makes it easier to create custom dashboards and reports using GA4 data, set up the dimensions and metrics you want to look at and create visualizations that make it quicker to spot changes in trends.
There are two options for exporting your GA4 data into Looker Studio. You can use the native Google connector. It’s free, easy to set up, and good for basic reporting. But there are a couple of issues:
- You may run into the Google Analytics sampling issue, which can affect the accuracy of your reports
- It lacks metrics and dimensions, so it’s harder to set up your reporting how you want it
You can use a third-party connector like the Supermetrics GA4-Looker Studio connector. The downside is that you have to pay for it. The upside is that:
- It helps avoid data sampling issues, even if you’re working with large data volumes
- You can blend Google Analytics 4 data with data from other sources (such as your paid media data) so you can see the overall performance of your marketing strategy
- Plus, you can add our pre-built Charts for Looker Studio to dive into your analytics more quickly
If you’d like to learn more about using the Supermetrics GA4 connectors, here’s a video on how to get started.
One point—you might have heard about the “quota apocalypse” hitting people trying to analyze GA4 data via Looker Studio. In short, there seems to be a significant limit to how many GA4 requests you can run in Looker Studio. If you’re running into this issue, here’s a guide to overcoming the Google Analytics 4 API quota limitation.
Integrate GA4 with Google Ads
It’s definitely a good idea to connect your Google Ads and your GA4 data. If you link your Google Ads account to your Analytics property, you’ll be able to see the full customer funnel—from the moment when your users click your ads to the final purchase and beyond.
This lets you:
- View Google Ads campaigns from within your Analytics account
- Set up attribution modeling for your Google Ad campaigns
- Use information from your Analytics to improve your Google Ads strategy
- Export your Analytics audiences to your Google Ads account so you can remarket to them via the Google Search Network, Google Display Network, or YouTube
Here’s a guide on how to link your Google Ads and Analytics accounts.
The Google Analytics 4 data retention policy
While Universal Analytics stored your data pretty much forever, in Google Analytics 4, your data will expire after either 2 or 14 months max with a standard account. (If you have Google Analytics 360, the maximum retention period is 50 months.)
So, finding an alternative way to save your historical data is important. That way, you can:
- Centralize your Universal Analytics data with other marketing data
- Feed the data to a BI tool like Looker Studio or Power BI for data visualization
- Perform historical and long-term trend analysis
If you want to keep your historical data, you’ll need to set up a data backup to protect it. The best solution is usually a marketing data warehouse. The obvious choice would be Google BigQuery since it’s a Googe product and has been built with marketers in mind.
The Supermetrics connector makes the process of transferring data from Google Analytics to BigQuery very straightforward. Or, if you’re already using another marketing data warehouse, like Azure Synapse Analytics or Snowflake, then not to worry—we’ve got connectors for them, too!
Over to you
So there you have it—everything you need to know to get started with Google Analytics 4!
There’s a lot that goes into becoming a confident GA4 user, but our top tips are:
- Start by becoming familiar with the basic terms and concepts, like Events and Key Events
- Set up your reports in ways that suit your team and processes—and if you’re struggling with the limitations of the GA4 native reports, then export your data to a tool you can use more comfortably
- If you’re a Universal Analytics user, you might want to spend some time learning the differences with the new models in GA4 — there are some pretty major differences, and they could really impact your understanding of your data
If you’re ready to go beyond the basics, then take a look at our GA4 Knowledge Center. You’ll find handy resources on everything from using Google Tag Manager to the best ways to visualize your GA4 data in Looker Studio.
About the author

Minna Tuikka
Minna is a Senior Growth Marketing Manager at Supermetrics, where she tackles website optimization, customer behavior analysis, and internal process development to fuel the company's success. Together with the internal team, she led the Google Analytics 4 migration project and produced multiple helpful content, including videos and blog posts, to help our customer get started with GA4. Prior to Supermetrics, Minna honed her skills at Kesko, a leading Finnish retail group. As a CRM Manager, she championed the adoption of marketing automation, streamlined processes for digital growth.
Rosanna Campbell
Rosanna is a Freelance Content Writer who writes non-boring content for B2B SaaS clients like Lattice, Dock, and monday.com. She lives in Spain with her husband, her son, and a beagle who eats her furniture.
Turn your marketing data into opportunity
We streamline your marketing data so you can focus on the insights.