Mar 18, 2019
Account-based marketing reporting: 9 ABM metrics that savvy B2B marketers really need to track
By Supermetrics
[ Updated Mar 10, 2023 ]
14-MINUTE READ · By Harpal Singh
For those in of you in the B2B space, you’ve probably come across the phrase: account-based marketing. This marketing philosophy evangelizes highly-targeted, ultra-relevant campaigns to a small group of prospects, rather than the alternative approach of casting your net far and wide in the hope that you’ll attract as many qualified leads as possible.
If you’re just starting out on your ABM journey, measurement can be a roadblock to driving successful outcomes. Given that the average enterprise deal involves 17 people, understanding what questions to ask of your data isn’t necessarily a straightforward task.
In this article, we’re going to take a look at the data-driven questions you should be asking across your ABM funnel to help develop your marketing reporting but within the context of an ABM strategy. We’ll then dive into specific metrics that you can use to quantify performance, and more importantly, look at key ways to improve on your metrics.
Breaking down the most important ABM metrics: ToFu, MoFu, BoFu
In this section we will break down the three most important metrics for the top, middle, and bottom of the ABM funnel. Top of funnel ABM metrics should answer are your target accounts engaging with your on-site and off-site content? Middle of funnel ABM metrics should answer are your target accounts finding value in your website content? And bottom of funnel ABM metrics should answer are your target accounts taking the desired actions?
Let’s dig in.
Top of Funnel Metrics: are your target accounts engaging with your on-site and off-site content?
The first part of an effective ABM equation is to look at how target accounts are engaging with your on-site and off-site content. Understanding who your ideal customer is important, as detailed understanding of this means that you can then:
- Better align your content with the needs of your target audience
- Create more engaging ad content to amplify your message
- Better assess the performance of your campaigns
Unlike inbound marketing, where you cast your net wide to reach as much of an audience as possible, with ABM you start with a list of strategically targeted accounts that you’ll continue to pursue on an ongoing basis, and refresh as necessary.
The three key metrics to look at in this phase are:
- Social Engagement from Target Accounts
- Total Web Visits from Target Accounts
- Unique Web Visits from Target Accounts
1. Social engagement from target accounts
Think of what occurs when you first discover a new LinkedIn page. The process might look a little like this:
- You stumble upon a Company thanks to a targeted ad, or a news feed share from a friend
- The content appeals to you, as it targets a specific pain point that’s impacting on your businesses’ bottom line
- You’re intrigued to learn more, so you follow the page, or click-through to the website
- A couple of weeks later, after your initial visit to the website, you’re hit by a retargeting ad on Facebook, and decide to sign-up for a demo
This example indicates why social engagement can be considered a primary top-of-funnel metric – it drives the awareness that feeds the rest of your funnel. It’s also the reason why sophisticated ABM teams invest so much in content – good, useful, content drives the machine that powers sales on the other side. Content could be amplified through both paid and organic channels, and key indicators of success may relate to likes, shares, downloads, video views, and opens.
When it comes to paid ads, platforms like LinkedIn allow you to take micro-targeting to another level, by specifying companies, roles, and even people to target via your campaigns. You can securely upload a list of company names, and then layer on targeting relating to job titles and job functions, to ensure that you reach the right decision-makers. This can also be a good way to get your content in front of multiple decision-makers within a company, and therefore increase targeted awareness.

2. Total web visits from target accounts
Driving content engagement is great, but actually getting target accounts to click-through to your landing page is where your ABM efforts will gain traction. Up until this point, your interacting on someone else’s platform, but once you facilitate a visit to a landing page or website, you can more effectively capitalise on the initial interest and move the prospect through the funnel.
Use tools like Leadfeeder to see which companies are actively visiting your website and owned properties. Visitor identification tools work by pulling information from your Google Analytics account (via the Google Analytics API) and looking this up against IP address data. This information not only tells you who your visitors are, but also which pages they’re viewing, and which campaigns they’re clicking-through from.
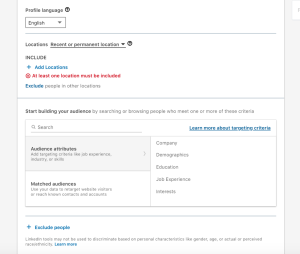
Image via leadfeeder.com
3. Unique web visits from target accounts
Going a step further than total web visits from target accounts, this metric looks at unique interactions which is particularly pertinent given that the average B2B deal can involve up to 17 people. Unique web visits can also signal that a company’s interest in your solution is hotting up, particularly if following on from a presentation, webinar, or sales meeting.
Gauging the number of visitors from a particular company can be tricky, as there’s no real way of identifying organisation-specific website users within most analytics packages. Thankfully, Leadfeeder’s clever ‘Booster’ feature allows you to gain insight on how many different people from a company are visiting your website. It does this by providing each visitor with a unique identification code that is tied back to leads visit data. You can even use the native integration between Leadfeeder and the LinkedIn to go one better, and identify exactly who is clicking through to your website.
Middle of Funnel Metrics: are your target accounts finding value in your website content?
At the top of the funnel, you get a gauge of who your target accounts are and the type of content they like to engage with. In the middle of the funnel, the focus turns to metrics that paint a picture of how well your audience is engaging with your broader website content. These are the metrics that you may want to incorporate as part of lead-scoring efforts.
The three key metrics to look at in this phase are:
- Depth Engagement Metrics (time on site & pages per session) from Target Accounts
- Video Starts/Completions from Target Accounts
- Key Page Views by Target Accounts
4. Depth engagement metrics (time on site & pages per session) from target accounts
As the name suggest, depth engagement metrics measure the depth of engagement relating to your on-site content. For example, how do target accounts engage beyond the initial click-through? Are they spending a considerable chunk of time on your website (vs. the average user) and visiting multiple pages? It’s useful to have an idea of what the average converting user’s journey looks like in respect to both time on site and pages per session metrics – and then benchmark this against target accounts. If you see that target account depth engagement is considerably less, you may want to look at auditing your site content for relevancy.
It’s also worth looking at Bounce Rate as an indicator of relevance between off-site content (i.e. ads), and on-site content. Google defines Bounce Rate as ‘the percentage of visits that go to only one page before exiting a site’. The following are reasons why target accounts may click on your LinkedIn ads, and subsequently ‘bounce’:
- Your content and landing page was not sufficiently aligned
- Your content didn’t meet expectations set by your ad
- Your landing page lacked any meaningful CTAs, or reasons to engage further
- Your targeting is out, and not sufficiently aligned to your value proposition
If you’re driving paid traffic to a landing page, it’s vital that there’s a strong thematic link between your target audience, the ad and the page itself – the ad should act as a ‘window’ to the page, as with the example below from IBM.
Note that IBM do several things well here; the headline of the ad and the landing page align, the content spells out some clear benefits in downloading the guide, and even if you’re not yet ready to convert, a well-placed link takes you to further content around IBM Watson Marketing. It could improve the user journey, by aligning colours with the ad itself (signalling continuation), and by reducing the number of fields required in the form, or simply making the form multi-step. But, all in all, assuming that the targeting was sufficiently tight, this is a landing page that gets more things right, and is a good example of strong ad-to-landing page relevancy.
5. Video starts/completions from target accounts
Video is often a stronger conduit of information than text. Especially with B2B, long-form content such as whitepapers and case studies can put people off consuming information. Watching a three minute video, on the other hand, is relatively painless. The power of video comes not only it its ability to transmit information more effectively than images and text, but also in the fact that video is 1,200% more likely to be shared vs. image and text-based content.
It’s for this reason why video is becoming more prevalent within the ABM toolbox.
In the middle of funnel, video could take shape in the form of an explainer video on your homepage or landing page. You may also be using video as a retargeting mechanism, across prominent social platforms such as Facebook and LinkedIn. For on-site video, the key metrics to focus on are likely to relate to on-site video starts, average duration viewed, and completions (i.e. watched 100% of your video). It’s also good practice to include some sort of call-to-action to ensure that people who view your content also take a desired action as a next step. The below example from Salesforce illustrates several aspects you could look to measure, including:
- # visitors that viewed at least 5 seconds of the video
- # visitors that viewed at least 50% of the video
- # visitors that viewed 100% of the video
- # visitors that viewed more than one video
- # visitors that clicked on CTA 1 (Editions & Pricing)
- # visitors that clicked on CTA 2 (Learn More)

For off-site video (i.e. video posted on social platforms), in addition to metrics that you would look to measure on-site, you could also look to capture shares, comments, and clicks to site.
6. Key page views by target accounts
Key pages may include pricing pages, about us pages, contact pages, case study pages or any other page that you deem to be important to the buying journey.
Again, the key here is to compare converting user journeys with target accounts. Are target accounts viewing the same pages? If not, could these be better sign-posted on landing pages with stronger focus on CTAs?

Bottom of Funnel Metrics: are your target accounts taking the desired action?
You’ve targeted the right accounts, found the pain point, made the right approach, conquered the initial obstacles to conversion, gained their trust, and they’re almost ready to take a leap of faith and complete your online funnel.
By now, your on-site and off-site content would have done its job in removing frictions to conversion, and the target account should now have a clear understanding of their problem or need state. For your bottom of funnel audience, the key metrics to look at are:
- Site Goal Completions by Target Accounts
- Sales Chat Initiations by Target Accounts
- Form Completions by Target Accounts
7. Site goal completions by target accounts
You may have a number of ‘soft’ on-site goal completions setup to indicate when buyer intent is gaining traction. These may include:
- Newsletter signups
- Webinar registrants
- Pricing download
- Gated content view
Not only can these provide an indication as to when someone is nearing conversion, but also can be used to form remarketing audiences (not quite converters, but more ‘advanced’ than site visitors).
A good way to optimise this particular part of the funnel is by utilising conversion tracking across your channels. For example, Google Analytics goal tracking can be used to set up ‘soft’ goals that build up to conversion, and then facilitate comparison across channels and marketing campaigns for efficacy. It will quickly become apparent which campaigns are driving on-site results, and which are wasting money.

8. Sales chat initiations by target accounts
If you have a form on your page, and your solution is relatively high-ticket, you need to have some sort of chat interface to help reduce friction to conversion. For one of our clients at Conversion Stars in the B2B hardware space, we were able to increase lead volume by 26% just by incorporating chat on the page. Sales chat can help to answer any pre-conversion questions around product, pricing, or other aspects of your offering.
Most sales chat software, such as Live Chat, have robust out-of-the-box reporting on chat interactions, which can help to break down:
- Number of chats initiated
- Chat response time
- % of chats answered within 1 minute
- % of chats that result in leads
One sure-fire way to increase chat engagement is to utilise personalised automated greetings. For example, with Live Chat you can create triggers based on a number of different criteria, including time on page, PPC keyword, the page that they’re viewing, and whether or not they are new visitors.

This means you can have different greetings for users based on page viewed. For example, someone seeing your greeting on your homepage will see a different message than someone engaging on a ‘high-intent’ page, like your pricing page – which translates into more meaningful conversations, and stronger chat engagement rates.
9. Form completions by target account
The key metric here is, of course, form completion rate. As the name suggests, this is the % of target accounts who complete your form vs. all target accounts who visited your page.
People at different stages of the user journey won’t necessarily respond to your form in the same way. A prospect who is ready to sign-up for a demo there and then will more likely hand over their details, than someone just entering the market and not yet fully-aware of their problem. Instead of a long, data-heavy form that will invariably act as point of friction for early-stage audiences, use a multi-step form which asks the soft ‘ice-breaker’ questions first.
At Conversion Stars we’re big fans of multi-step forms. We’ve done numerous tests on this and found that Conversion Rate could increase by up to 2.7%, just by making your form multi-step.
For Market Logic, the ‘ice-breaker’ question revolved around isolating a marketer’s biggest pain-point from a dropdown list.

After step one, the second step would be to follow up with the ‘hard’ data requests around name, email address, company etc. With the ice-breaker questions out of the way, the visitor would be more inclined to hand this information over, in comparison to asking for this data with a conventional one-step form. Types of ice breaker questions include:
- Who’s your #1 competitor?
- What part of {insert industry function here} are you struggling with right now?
- How much are you looking to grow {insert example function-specific goal here} by in the next 12 months?
- Are you looking for {product A} or {product B}?
Putting it all together: the ABM metrics funnel
Wow, that’s a lot of metrics covered!
When measuring value throughout the funnel in an ABM model, it’s crucial that marketing and sales combine as one. With a traditional siloed approach, marketing attracts the leads, which are then handed over to sales to convert. With account-based marketing, the process is somewhat more strategic, with both sales and marketing working together to define what’s important. For example:
- Top of Funnel – Are the right accounts coming to your site? Mapping out your market as a joint exercise between marketing and sales provides you with a birds-eye view of who the most relevant target accounts are. Both functions should align to build a picture of the key stakeholders involved within the buying journey. As sales are ‘closest to the furnace’ here, their input will be invaluable.
- Middle of Funnel – Are the right accounts finding value in your website content? Marketing will know from past experience, what’s worked well around the top-end of the funnel. Sales, on the other hand, will have more clarity on what content helps to get deals over the line. Bringing those two perspectives together enables greater relevancy and cut-through.
- Bottom of Funnel – Are the right accounts taking the desired actions? Marketing and sales need to collectively review the deal pipeline, from lead stage to handover, in order to understand the bottlenecks across each stage. Automated lead tracking should be in place in order to understand the value of each campaign, allowing for both marketing and sales teams to make data-driven decisions with confidence.
Building a true partnership between marketing and sales is the end-goal, but alignment in understanding the value that each function adds is the first step of that process.
In summary, our trusty ABM metrics matrix breaks down each key metric, by stage within the funnel.

At Conversion Stars, we use Supermetrics to track performance. The Supermetrics for Google Sheets add-on offers more than 40+ data sources you can pull metrics from, including Google, Facebook, and (crucially, for ABM marketers) LinkedIn.
This means that you can create and share informative dashboards that showcase the value of your ABM strategy, and easily drill-down throughout the funnel, like the one below.

Google Data Studio makes it super-easy to analyze target account interactions across marketing and sales touch points.
In our next post, we’ll look at the steps involved in creating a basic ABM dashboard. We’ll uncover how to connect your key data sources (with the help of Supermetrics, of course!), and then how to translate your raw data into meaningful and engaging visuals that help to communicate the value of your account-based marketing strategy.
About Harpal Singh
Harpal Singh is Managing Director at Conversion Stars, a London-based marketing agency that helps companies drive more conversions through their PPC campaigns. You can find him on Twitter, LinkedIn, and of course, the Conversion Stars blog, which covers PPC and landing page optimisation.
Turn your marketing data into opportunity
We streamline your marketing data so you can focus on the insights.